
The world's largest study on churn
This episode might reference ProfitWell and ProfitWell Recur, which following the acquisition by Paddle is now Paddle Studios. Some information may be out of date.
Originally published: Jan 29th, 2018
Churn is one of the most painful aspects of building a subscription business. You work incredibly hard to acquire customers, prime them with the right value proposition, do everything you can to make them happy, only to be left with a non-descript reason as to why they're leaving and will never be seen again.
To help, here's the first episode of our new series, the PW Report, where each week we go into the subscription economy benchmarks that you can't get anywhere else. This week we heard from David Cancel, CEO and Founder of Drift who wanted to know the state of churn in the subscription economy.
To understand the current state of retention, we pulled data from over three thousand subscription companies of all shapes, sizes, and verticals. We'll initially break down where churn stands overall, and then dig into some actionable trends for you to take advantage of for your business.
But first, if you like this kind of content and want to learn more, subscribe to get in the know when we release new episodes.

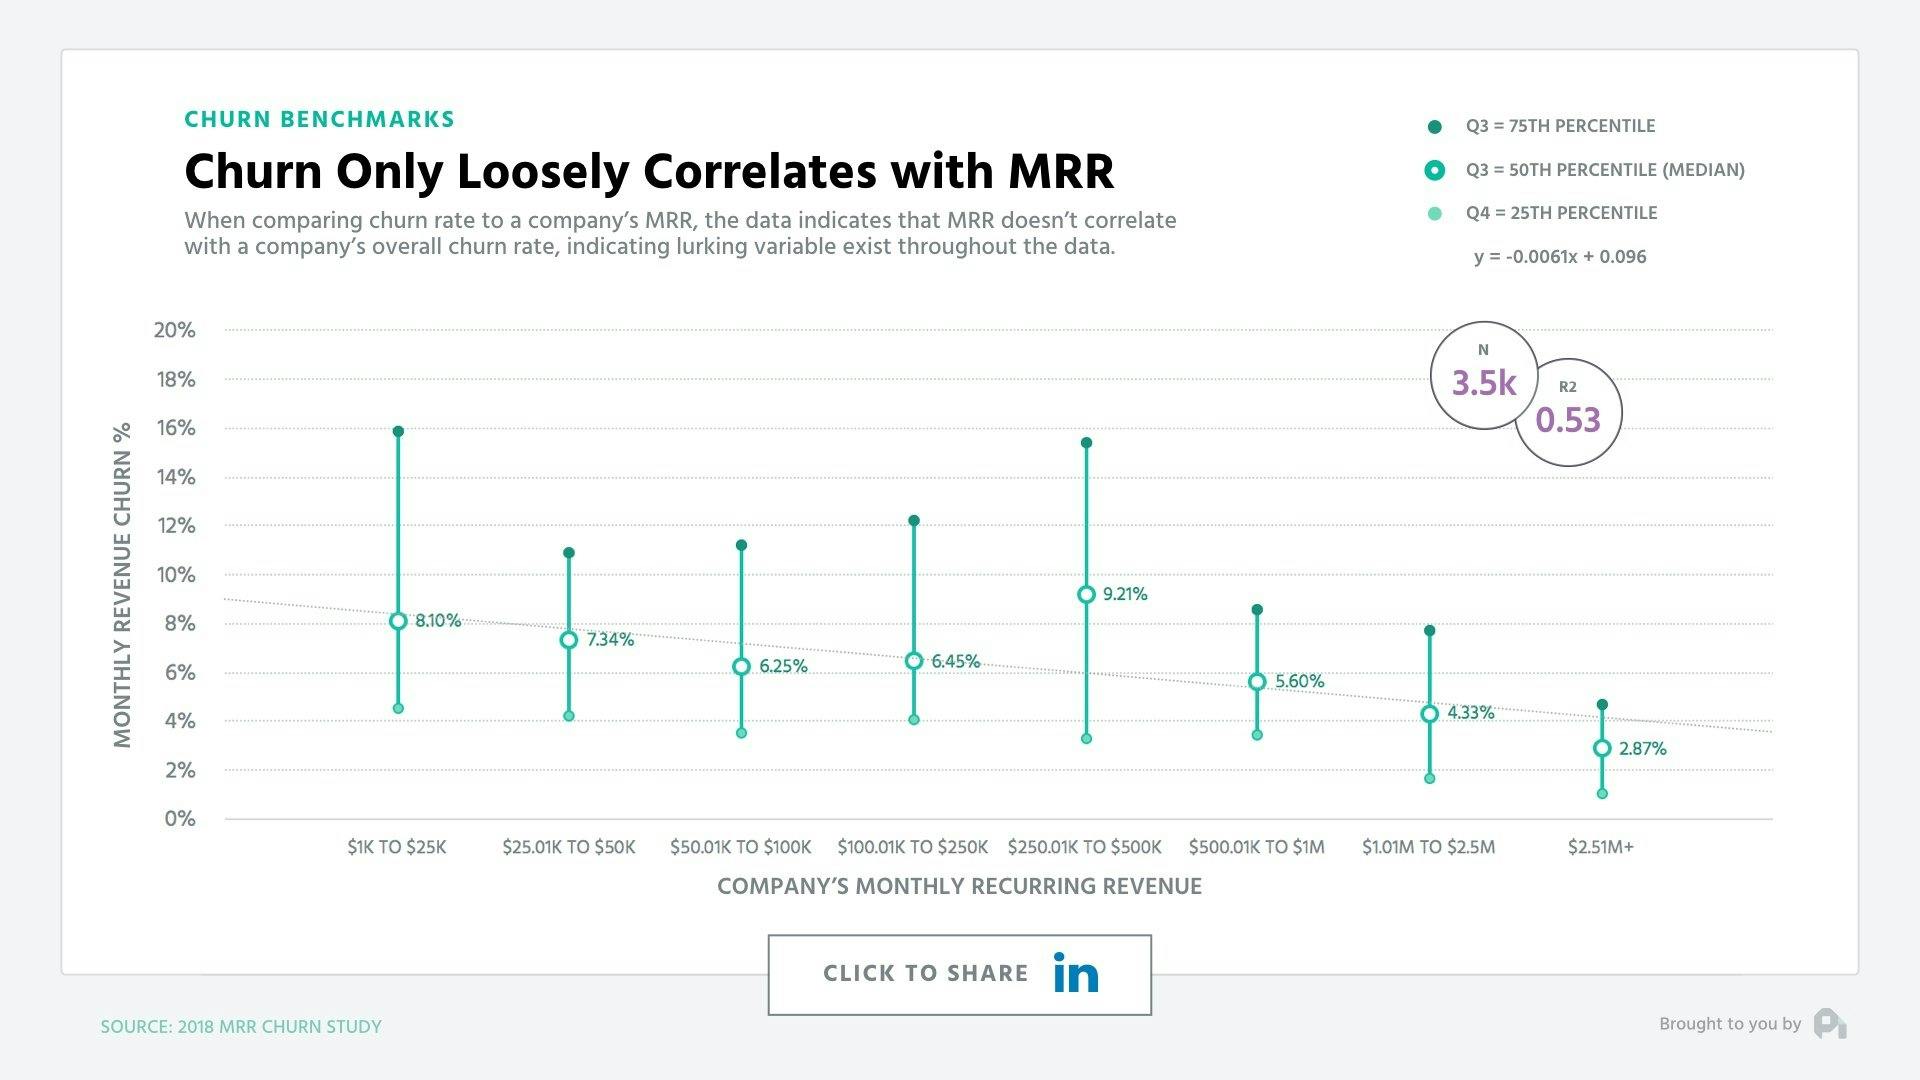
Churn vs. MRR: Churn only loosely correlates with MRR
First up - While we love to click and retweet articles about lowering our churn, it turns out churn is actually much higher than most companies are willing to admit and only loosely correlates with a company’s size, meaning as a company gets bigger churn tends to get smaller, but only slightly. What's especially interesting is the wide interquartile range that fluctuates between 5% to 16% gross revenue churn on the low end, and 2% to 8% on the high end.
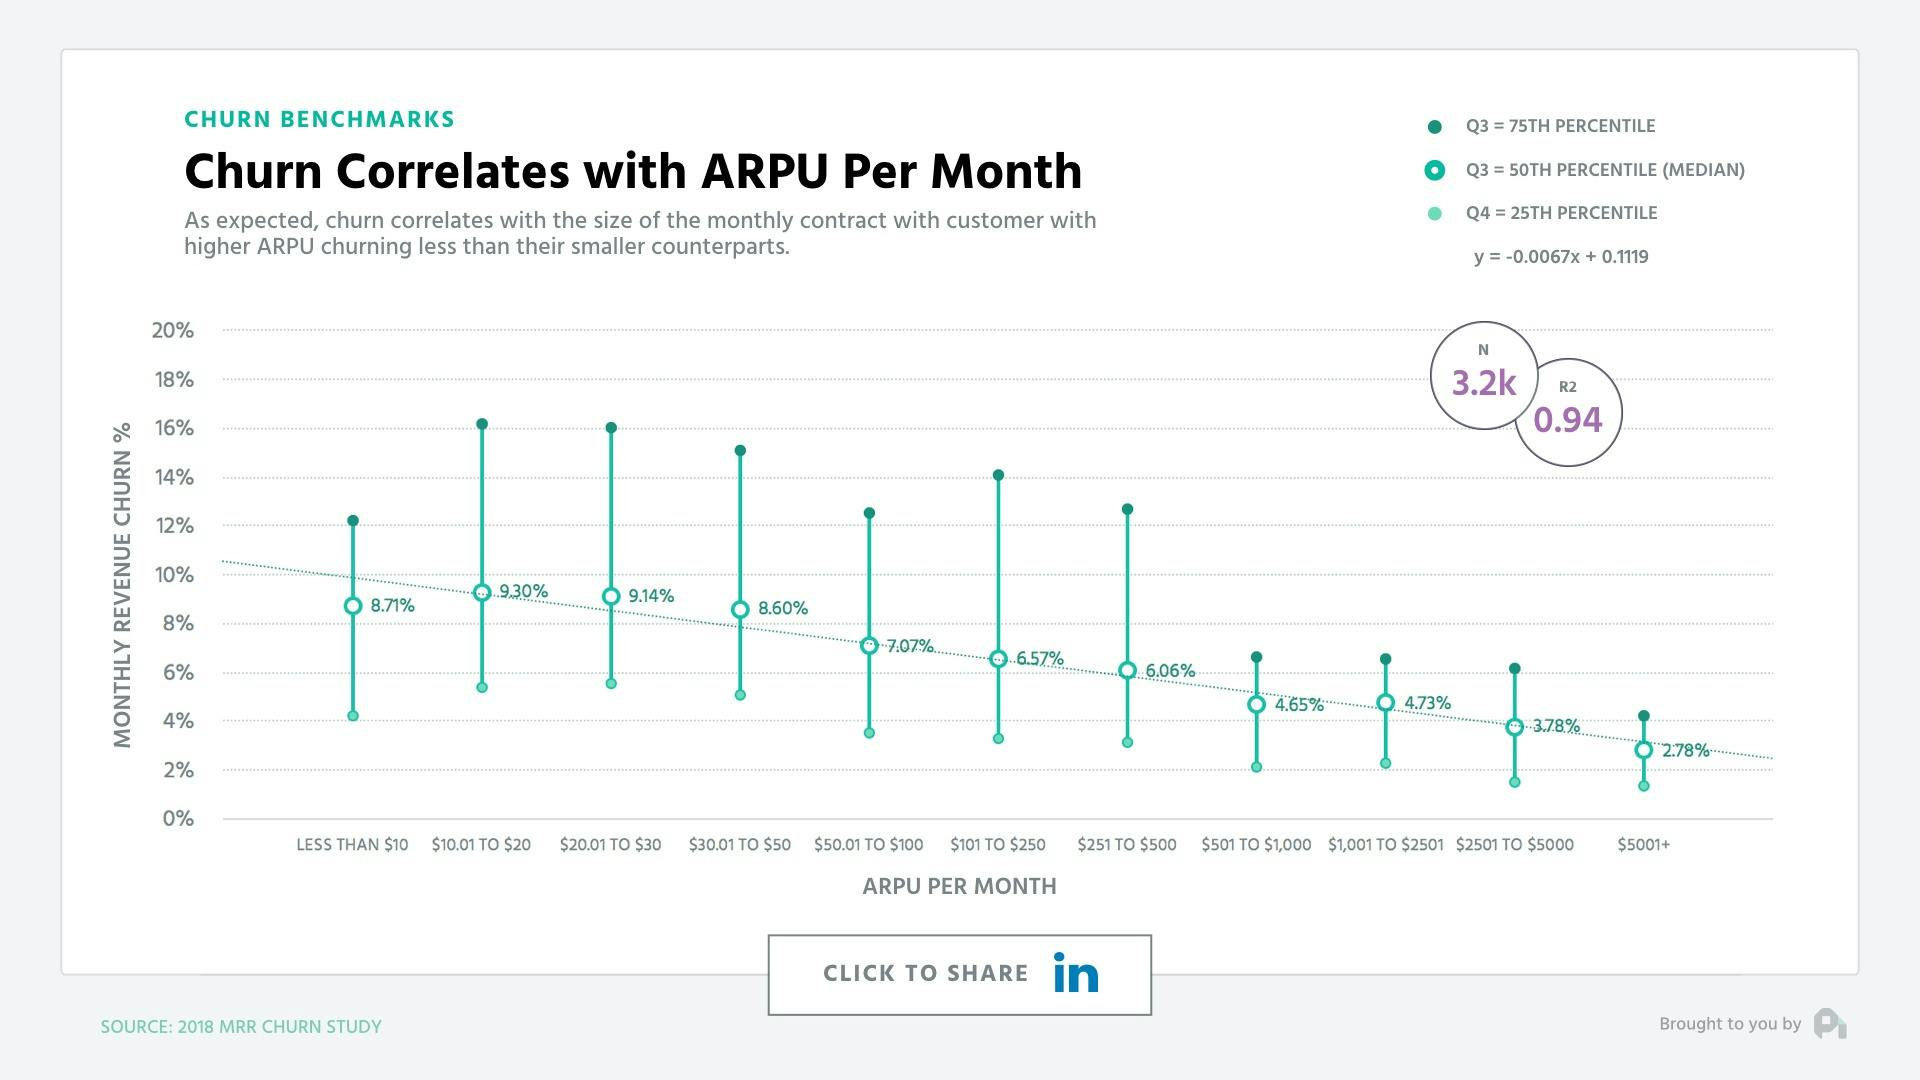
Churn vs. ARPU: Higher ARPU correlates to less churn
Perhaps most telling, there's a strong correlation when comparing ARPU (average revenue per user) and churn. Single and double digit ARPU correlated with churn between 3% and 15%, whereas four figure ARPU dropped to 1% to 5%. This is to be expected, because high ARPU tends to come with a more consultative sales team, more customer success, and more attention surface area per customer.
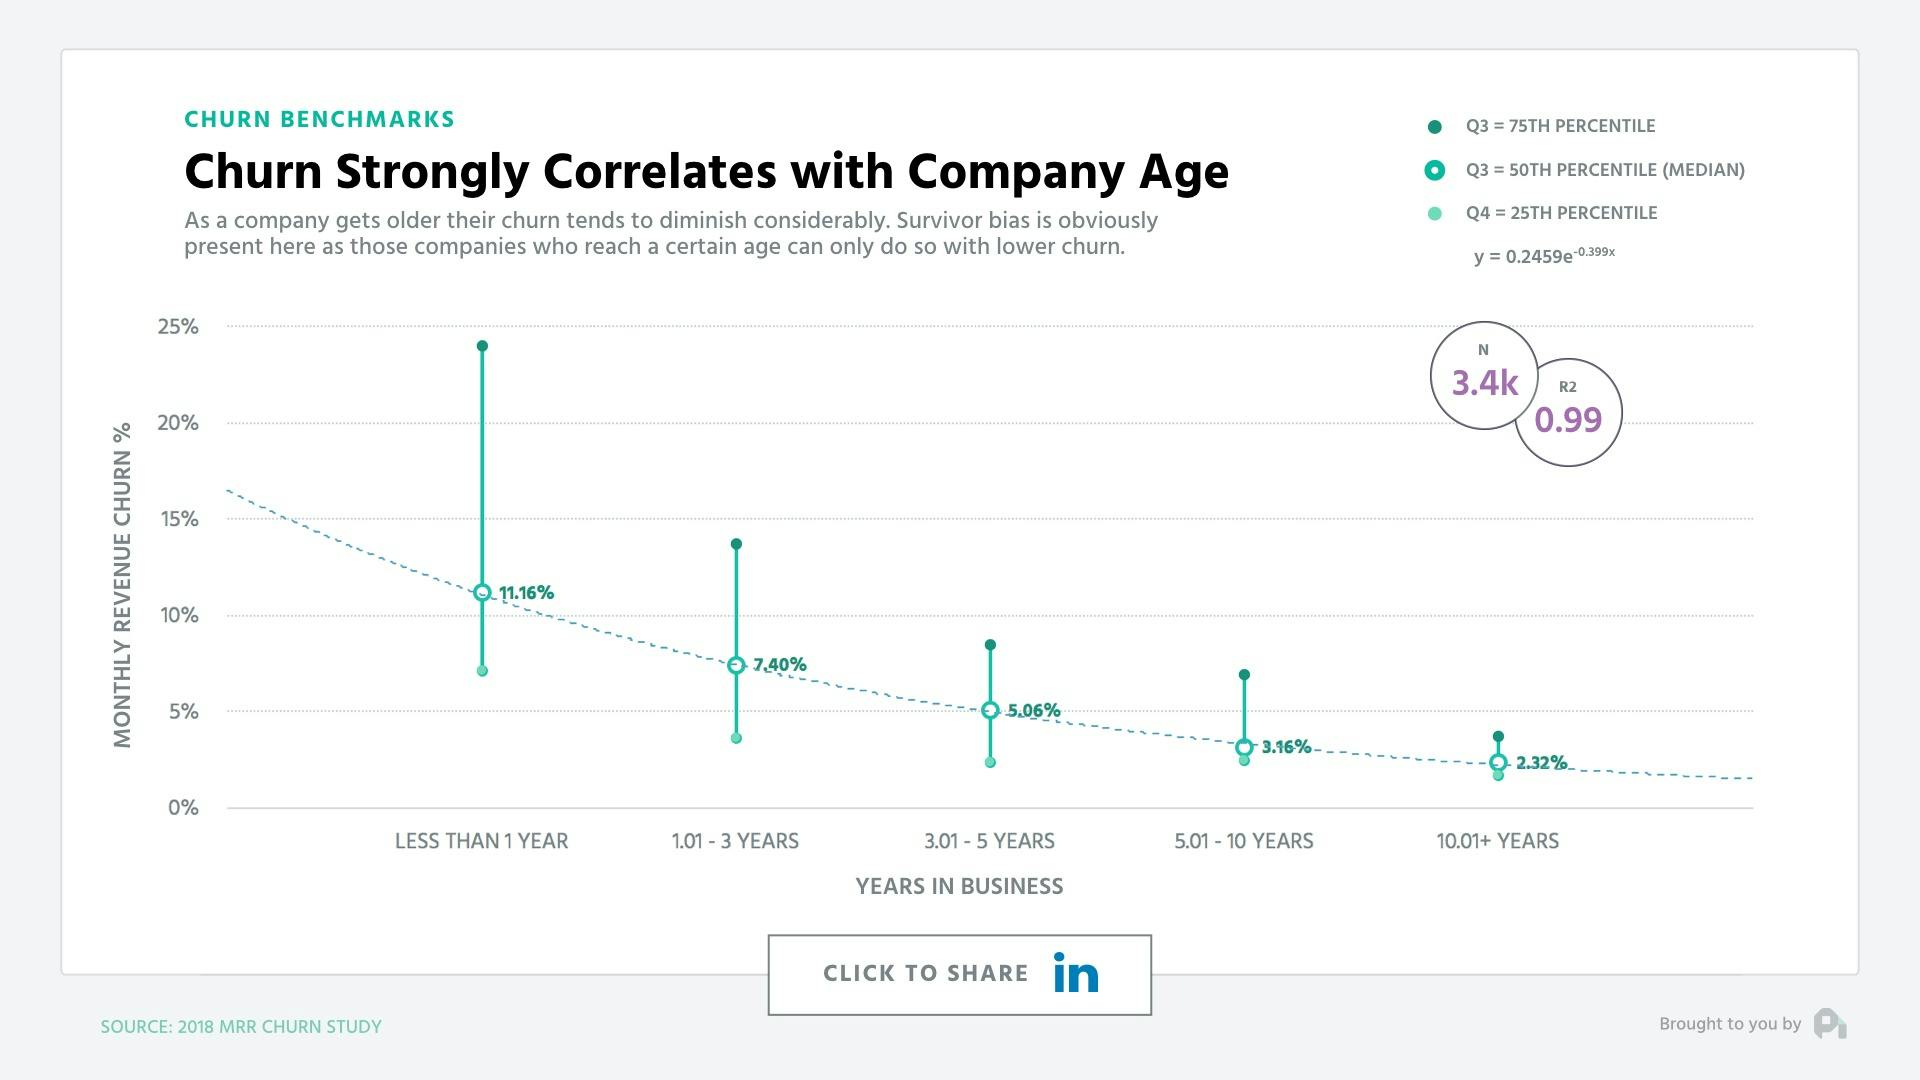
Churn vs. Age: Older company correlates to less churn
Interestingly enough, we saw a similarly strong correlation when it came to the age of the company with companies longer in the tooth seeing significantly lower churn than those who were younger. Of course there's survivor bias here, but you'd hope to see this when it comes to a growing company.
Let's dig into some truly actionable cuts answering what are the biggest influences on churn we could find.
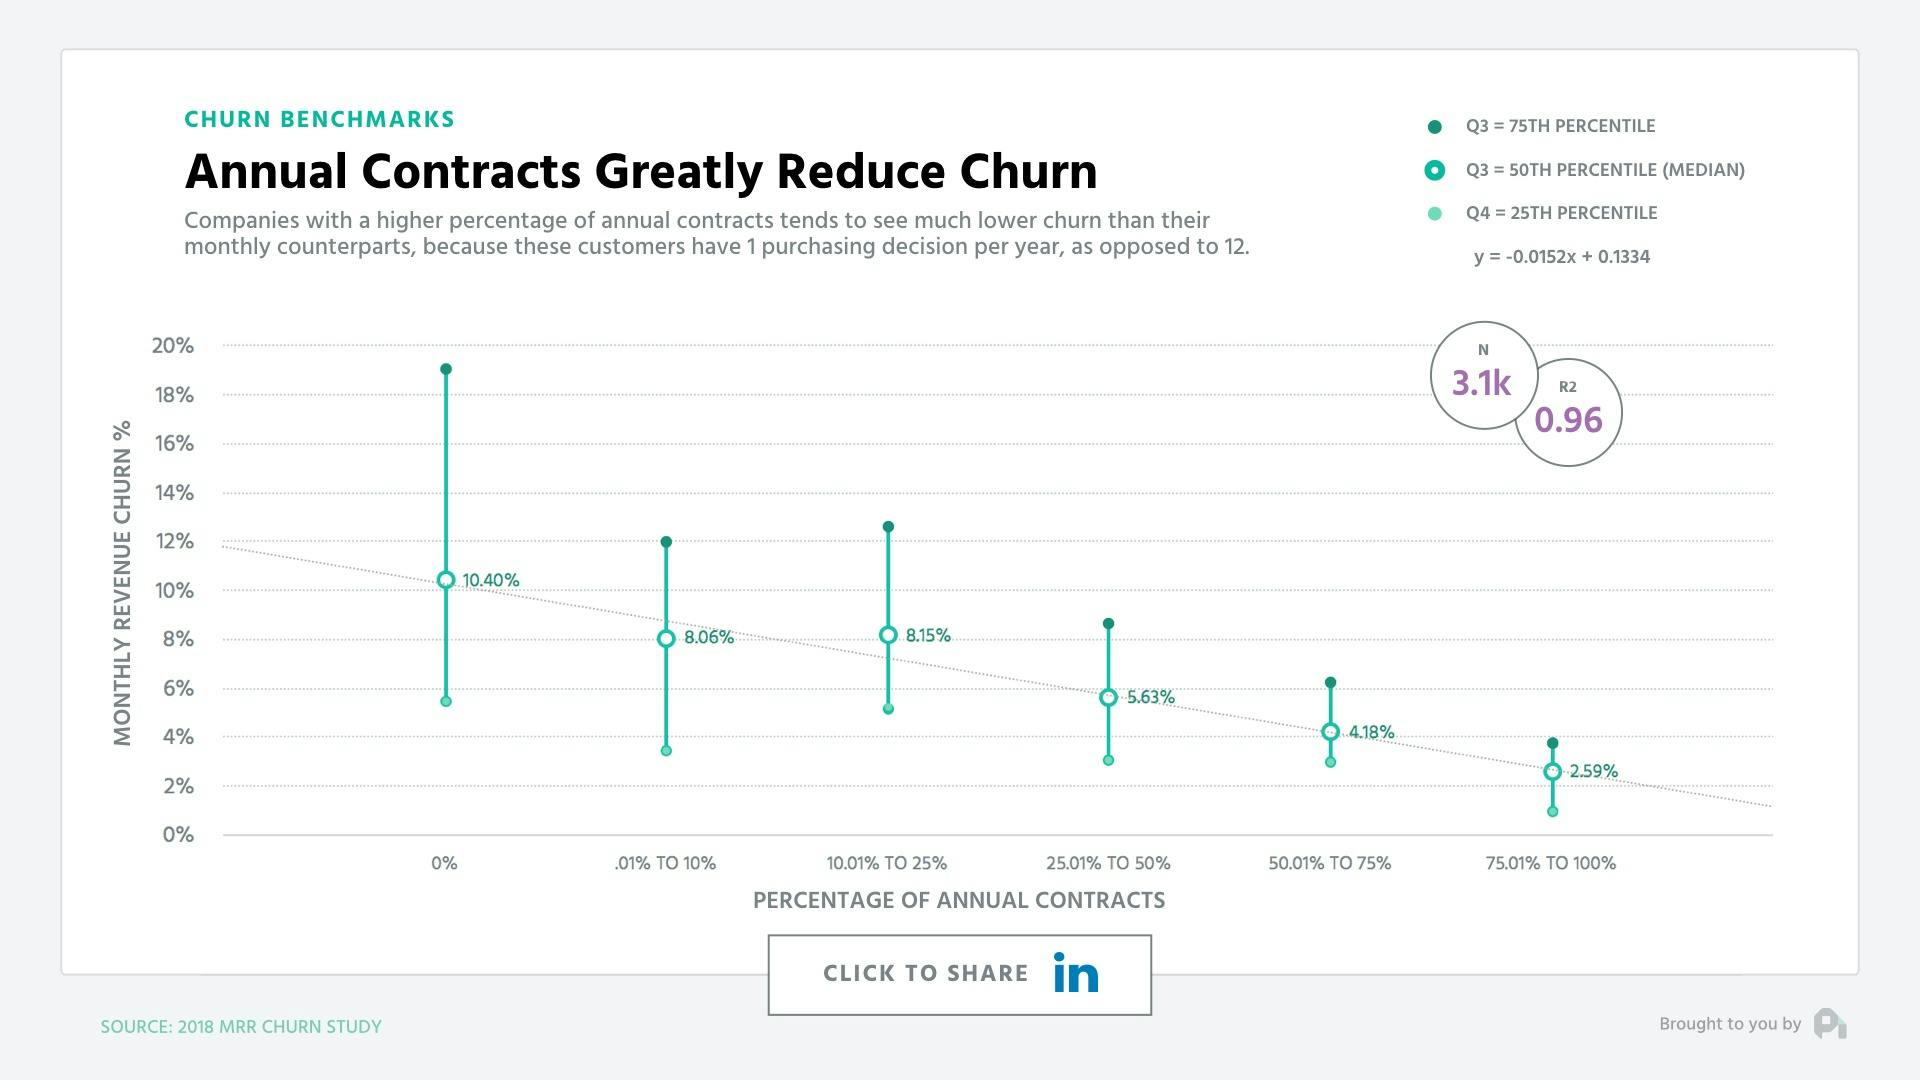
Tip: Increase proportion of annual contracts
Along this axis, the first piece was really the proportion of annual contracts in the business. Regardless of ARPU, those companies with a higher percentage of annual contracts see significantly lower churn. This is because these customers have only one purchasing decision per year (albeit a larger one) whereas their monthly counterparts have 12 purchasing decisions per year.
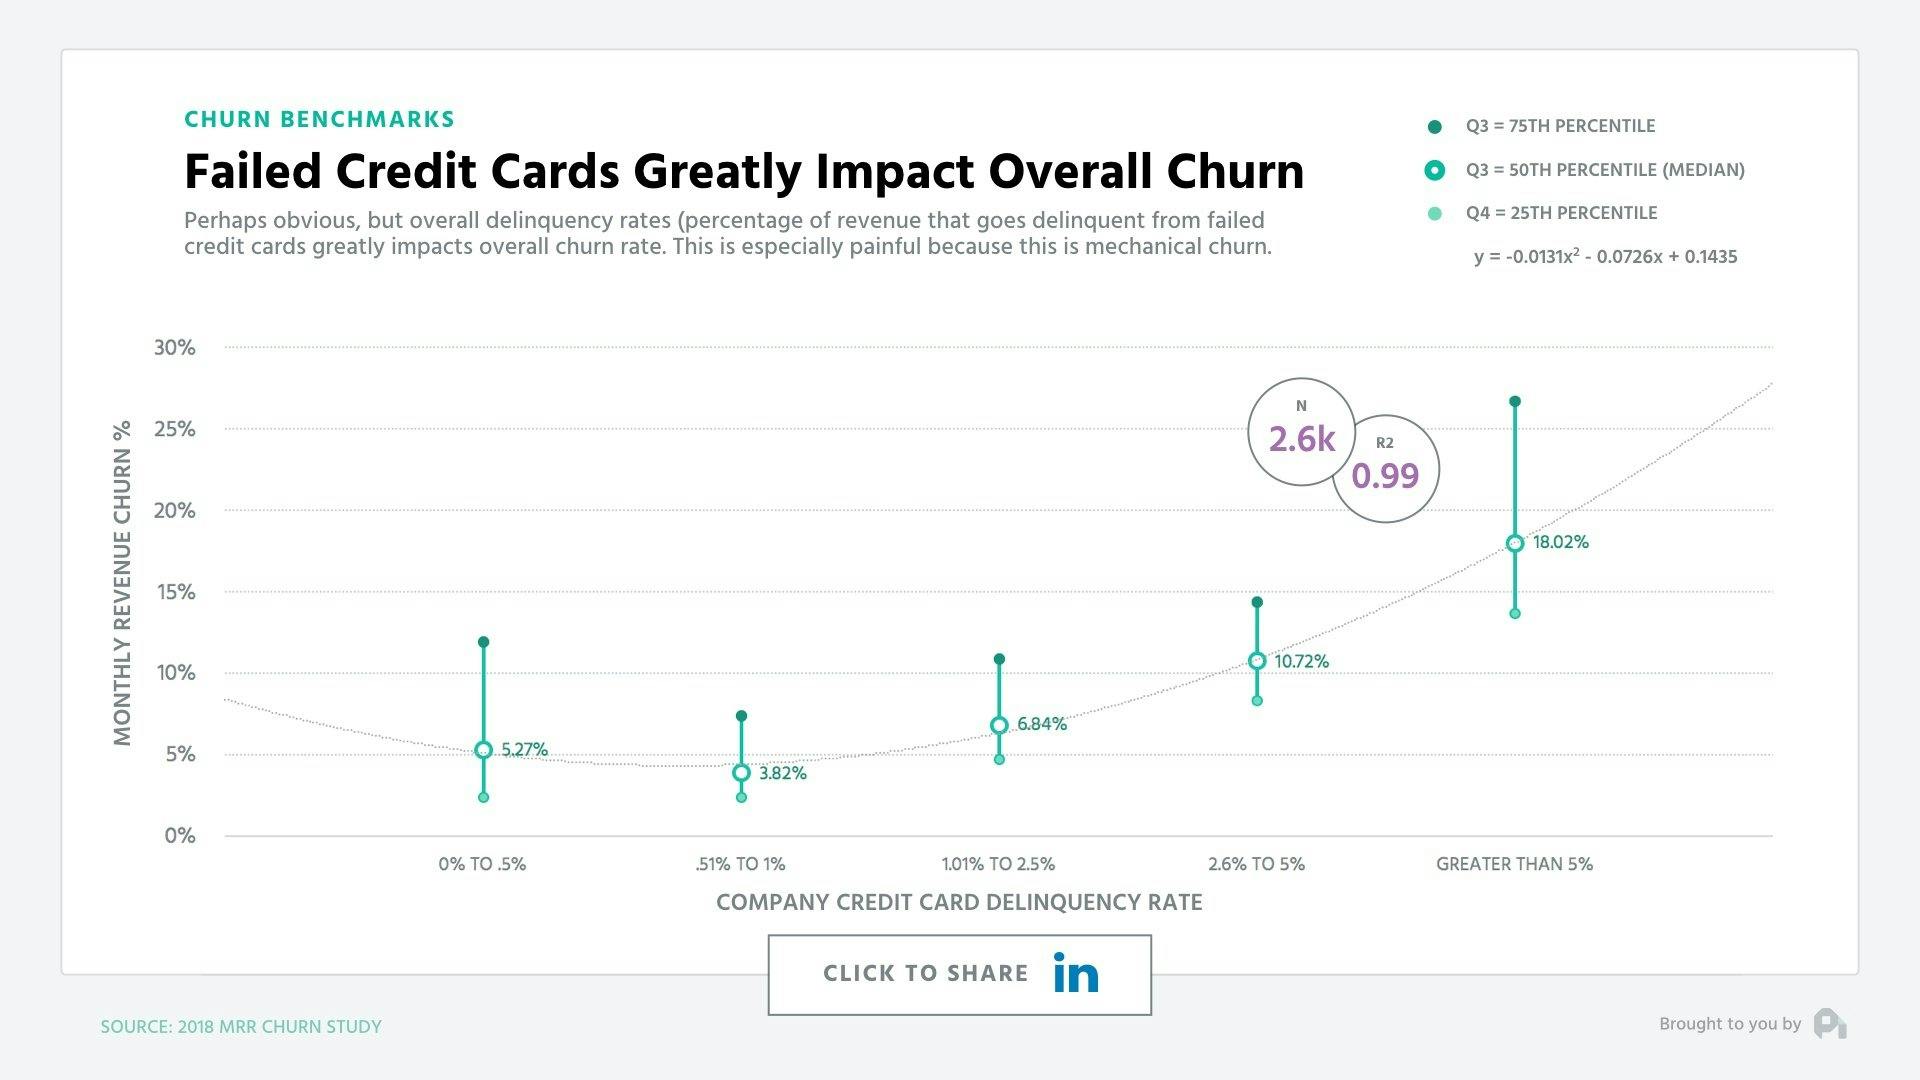
Tip: Bring down your credit card failure rate
Delinquency rate also significantly correlated with high churn. Delinquencies are credit card failures, and it turns out 20-40% of churn is typically from delinquent churn. This churn is painful because it's completely mechanical with over 130 different reasons a credit card will fail, but most companies don't have a good solution for combatting this churn.
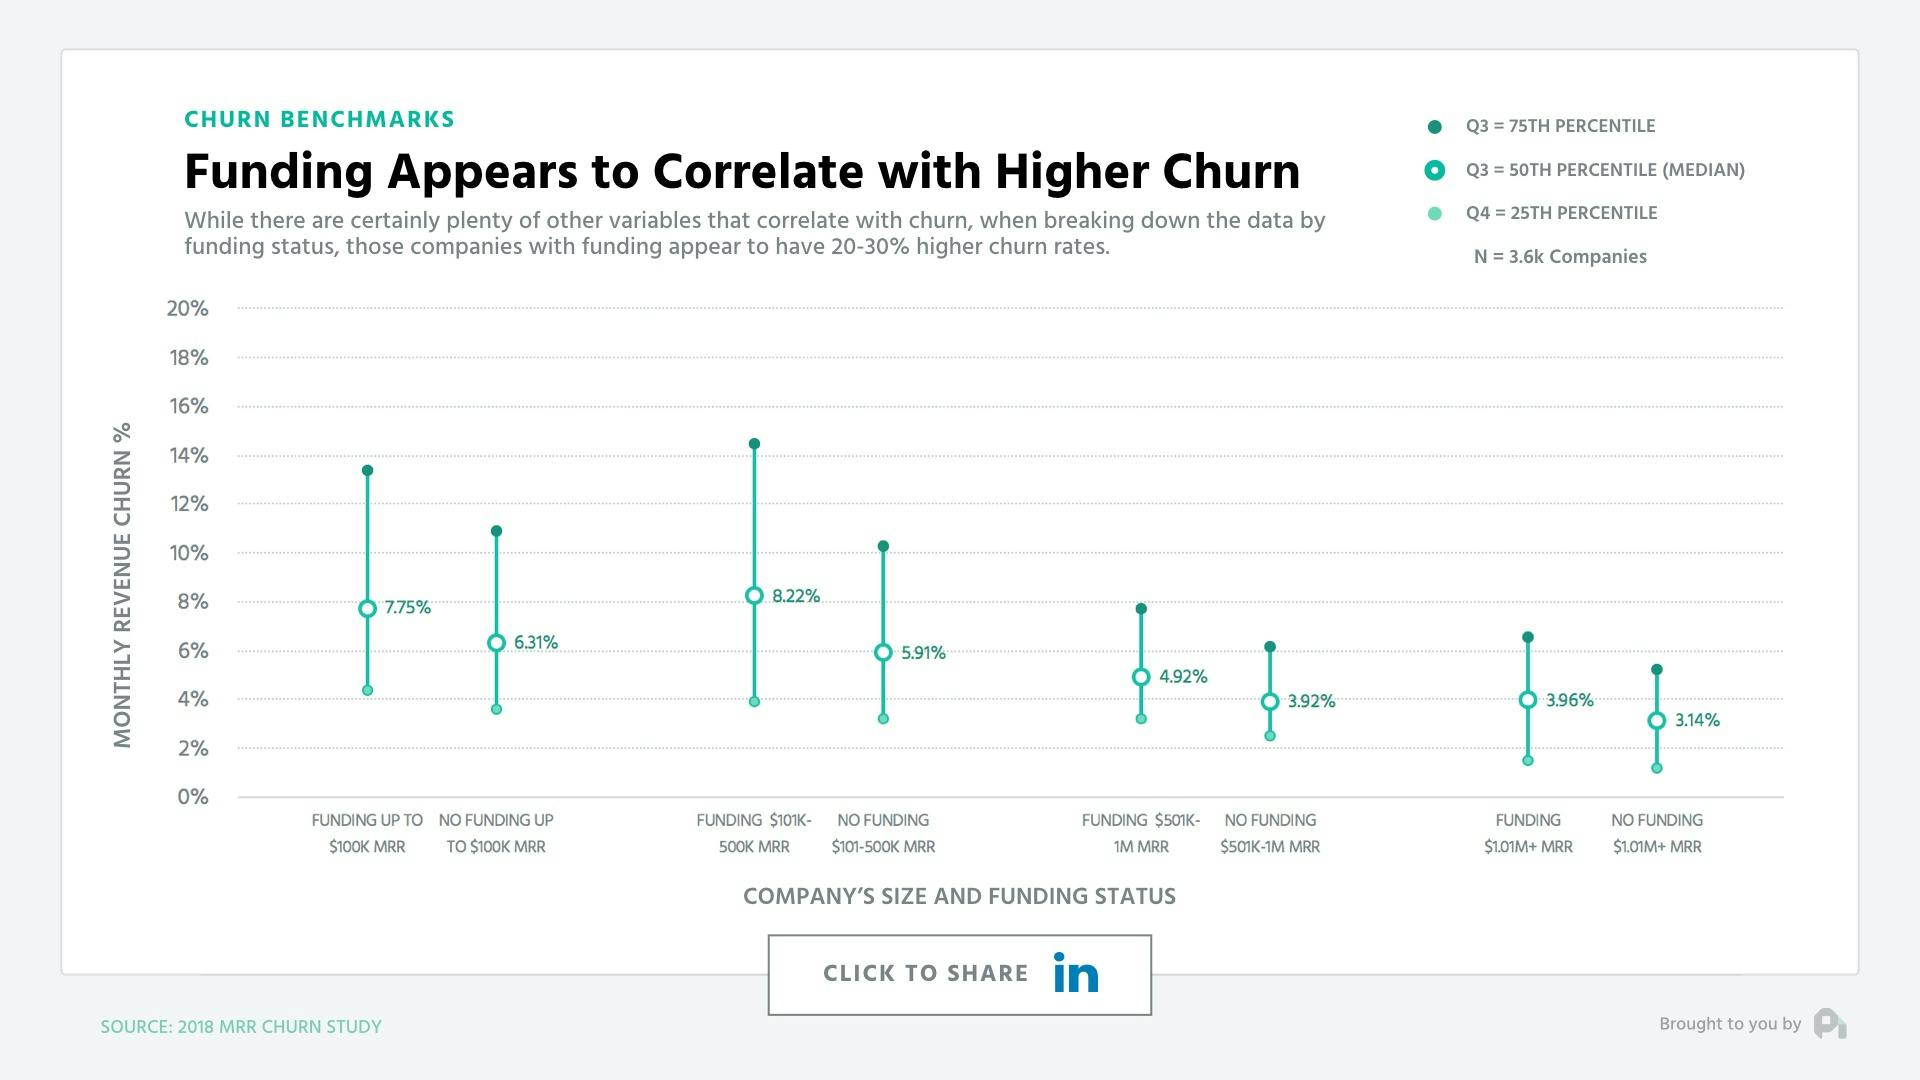
Churn vs. VC Funding: Churn 20-30% higher with funding
Finally, and likely most controversially, we found that those companies with funding saw 20-30% higher churn rates than those who didn't take on funding. There's likely a number of reasons for this, but through qualitative research we've found that a likely culprit is the false sense of security that comes with the moral hazard of being able to spend your way out of growth holes. Not saying don't raise funding, but be careful and ensure funding is a tool, not a crutch or a bandaid.
Check out our other episode about content marketing: is it dead? and subscribe to the show to get new episodes.
1
00:00:00,240 --> 00:00:03,660
You've got the questions
and we have the data.
2
00:00:03,680 --> 00:00:07,360
Each week, we dive deep on benchmarks
of the subscription economy that
3
00:00:07,360 --> 00:00:09,475
you just can't get anywhere
4
00:00:10,555 --> 00:00:10,875
else.
5
00:00:10,875 --> 00:00:13,975
This is the ProfitWell Report.
6
00:00:14,555 --> 00:00:17,035
Welcome to the ProfitWell
Report. I'm Patrick Campbell.
7
00:00:17,035 --> 00:00:20,189
And this week, we have a
question from the CEO of Drift,
8
00:00:20,189 --> 00:00:20,889
David Cancel.
9
00:00:20,889 --> 00:00:24,387
Yo, Patrick. It's the uncle,
uncle DC. What's going on?
10
00:00:24,387 --> 00:00:27,885
What's the latest state and
retention in the market today?
11
00:00:27,885 --> 00:00:30,845
I know you got the data.
Stop holding on on me.
12
00:00:30,845 --> 00:00:32,685
Send it to me. I wanna know.
13
00:00:32,685 --> 00:00:33,485
Let's get it.
14
00:00:33,485 --> 00:00:34,605
Love me some DC,
15
00:00:34,605 --> 00:00:37,165
and this is a phenomenal
question that I've been wanting
16
00:00:37,165 --> 00:00:39,490
to dig in on for
quite some time.
17
00:00:39,490 --> 00:00:41,410
To understand the current
state of retention,
18
00:00:41,410 --> 00:00:44,210
we pull data from over three
thousand different subscription
19
00:00:44,210 --> 00:00:46,805
companies of all shapes,
sizes, and verticals,
20
00:00:46,805 --> 00:00:50,005
and we'll initially break down
where churn stands overall and
21
00:00:50,005 --> 00:00:52,245
then dig into some actionable
trends for you to take
22
00:00:52,245 --> 00:00:54,060
advantage of in your business.
23
00:00:54,060 --> 00:00:58,380
First up, while we love to click and
retweet articles about lowering our churn,
24
00:00:58,380 --> 00:01:01,340
it turns out churn is actually
much higher than most companies
25
00:01:01,340 --> 00:01:05,455
are willing to admit and only loosely
correlates with a company's size.
26
00:01:05,455 --> 00:01:07,695
Meaning as a company gets
bigger from a revenue
27
00:01:07,695 --> 00:01:11,520
perspective, churn tends to
get smaller, but only slightly.
28
00:01:11,520 --> 00:01:14,320
What's really interesting is
the wide interquartile range
29
00:01:14,320 --> 00:01:17,200
that fluctuates between five
and sixteen percent revenue
30
00:01:17,200 --> 00:01:21,075
churn on the low end and two to
eight percent on the high end.
31
00:01:21,075 --> 00:01:22,275
Perhaps most telling,
32
00:01:22,275 --> 00:01:26,195
there's actually a strong correlation
when comparing ARPU and churn.
33
00:01:26,195 --> 00:01:29,050
Single and double digit ARPU
correlated with with churn
34
00:01:29,050 --> 00:01:30,890
between three and
fifteen percent,
35
00:01:30,890 --> 00:01:34,890
whereas four figure ARPU actually
dropped to one to five percent.
36
00:01:34,890 --> 00:01:37,835
This is to be expected because
high ARPU tends to come with
37
00:01:37,835 --> 00:01:40,795
things like consultative
sales, customer success,
38
00:01:40,795 --> 00:01:44,020
and simply just more surface
area per customer that you can
39
00:01:44,020 --> 00:01:45,460
give attention to.
40
00:01:45,460 --> 00:01:46,420
Interestingly enough,
41
00:01:46,420 --> 00:01:49,620
we saw a similarly strong
correlation when it came to the
42
00:01:49,620 --> 00:01:51,045
age of the company.
43
00:01:51,045 --> 00:01:53,845
With companies longer in the
tooth seeing significantly
44
00:01:53,845 --> 00:01:56,165
lower churn than those
who were younger.
45
00:01:56,165 --> 00:01:58,165
Of course, there's
survivor bias there,
46
00:01:58,165 --> 00:02:01,230
but you'd hope to see that when
it comes to a growing company.
47
00:02:01,230 --> 00:02:04,510
You can find more cuts on a benchmarking
basis in the show notes below,
48
00:02:04,510 --> 00:02:07,790
including things like b to b
versus b to c and a breakdown
49
00:02:07,790 --> 00:02:08,990
by customer target.
50
00:02:08,990 --> 00:02:12,365
But let's dig into some fully
actionable cuts answering
51
00:02:12,365 --> 00:02:15,885
what's the biggest influences
on churn that we could find.
52
00:02:15,885 --> 00:02:18,610
Along this axis, the first
piece that was really,
53
00:02:18,610 --> 00:02:22,450
really telling was the proportion
of annual contracts in a business.
54
00:02:22,450 --> 00:02:23,570
Regardless of ARPU,
55
00:02:23,570 --> 00:02:26,435
those companies with a higher
percentage of annual contracts
56
00:02:26,435 --> 00:02:28,515
saw significantly lower churn.
57
00:02:28,515 --> 00:02:31,315
This is because these customers
have only one purchasing
58
00:02:31,315 --> 00:02:33,860
decision per year,
albeit a larger one,
59
00:02:33,860 --> 00:02:36,020
whereas their monthly
counterparts have twelve
60
00:02:36,020 --> 00:02:38,020
purchasing decisions per year.
61
00:02:38,020 --> 00:02:41,780
Delinquency rate also significantly
correlated with higher churn.
62
00:02:41,780 --> 00:02:43,460
Delinquencies, for those
of you who don't know,
63
00:02:43,460 --> 00:02:44,555
are credit card failures,
64
00:02:44,555 --> 00:02:47,675
and it turns out that twenty to
forty percent of your churn is
65
00:02:47,675 --> 00:02:50,315
actually typically from
delinquent credit cards.
66
00:02:50,315 --> 00:02:53,800
This churn is painful because
it's completely mechanical with
67
00:02:53,800 --> 00:02:57,160
over a hundred and thirty different
reasons that a credit card will fail,
68
00:02:57,160 --> 00:03:00,120
but most companies don't
have something implemented to
69
00:03:00,120 --> 00:03:01,905
actually combat this churn.
70
00:03:01,905 --> 00:03:05,005
Finally, and likely
most controversially,
71
00:03:05,265 --> 00:03:08,625
we found that those companies
with funding saw twenty to
72
00:03:08,625 --> 00:03:12,920
thirty percent higher churn rates
than those who didn't take on funding.
73
00:03:12,920 --> 00:03:15,560
There's likely a number
of reasons for this,
74
00:03:15,560 --> 00:03:17,320
but through some
qualitative research,
75
00:03:17,320 --> 00:03:20,705
we found that a likely culprit
is the false sense of security
76
00:03:20,705 --> 00:03:23,905
that comes with the moral
hazard of being able to spend
77
00:03:23,905 --> 00:03:25,540
your way out of growth holes.
78
00:03:25,540 --> 00:03:27,620
And we're not saying
don't raise funding,
79
00:03:27,620 --> 00:03:30,420
but make sure you're using
funding for what it's made for
80
00:03:30,420 --> 00:03:34,435
which is a tool and not a
crutch that you need to rely on.
81
00:03:34,435 --> 00:03:35,555
Well, that's all for now.
82
00:03:35,555 --> 00:03:36,755
Thank you, David,
for the question,
83
00:03:36,755 --> 00:03:39,875
and I trust everything is
going amazingly well at Drift.
84
00:03:39,875 --> 00:03:42,720
If you want us to research
further into this dataset or
85
00:03:42,720 --> 00:03:45,040
research an entirely
different dataset,
86
00:03:45,040 --> 00:03:48,000
feel free to reach out to me
with a video at p c at profit
87
00:03:48,000 --> 00:03:51,135
well dot com, and we'll
have more for you next week.
88
00:03:53,495 --> 00:03:55,815
This week's episode is
brought to you by Crazy Egg.
89
00:03:55,815 --> 00:03:58,855
See what makes your visitors
lead by seeing how users click
90
00:03:58,855 --> 00:04:00,343
and scroll through your website.
91
00:04:00,343 --> 00:04:02,328
Crazy egg dot com.