
How to Price a SaaS Offer
This episode might reference ProfitWell and ProfitWell Recur, which following the acquisition by Paddle is now Paddle Studios. Some information may be out of date.
Originally published: April 4th, 2018
Value metrics are what you charge for, where it could be some measure of usage, some per user pricing, or even a cut of cash made from a product. So to answer Zeal's question, we looked at over 6,000 companies and data from nearly 600,000 subscriber buyers, and here's what we found.
But first, if you like this kind of content and want to learn more, subscribe to get in the know when we release new episodes.

Deeper insights into value metrics
For one, it’s hard to deny the impact of value metrics on a business, particularly when it comes to growth. When we compare companies utilizing some sort of value metric versus those who are strictly utilizing feature differentiation, those who have value metric based pricing are growing at nearly double the rate as their feature differentiated counterparts - and the gap is widening.
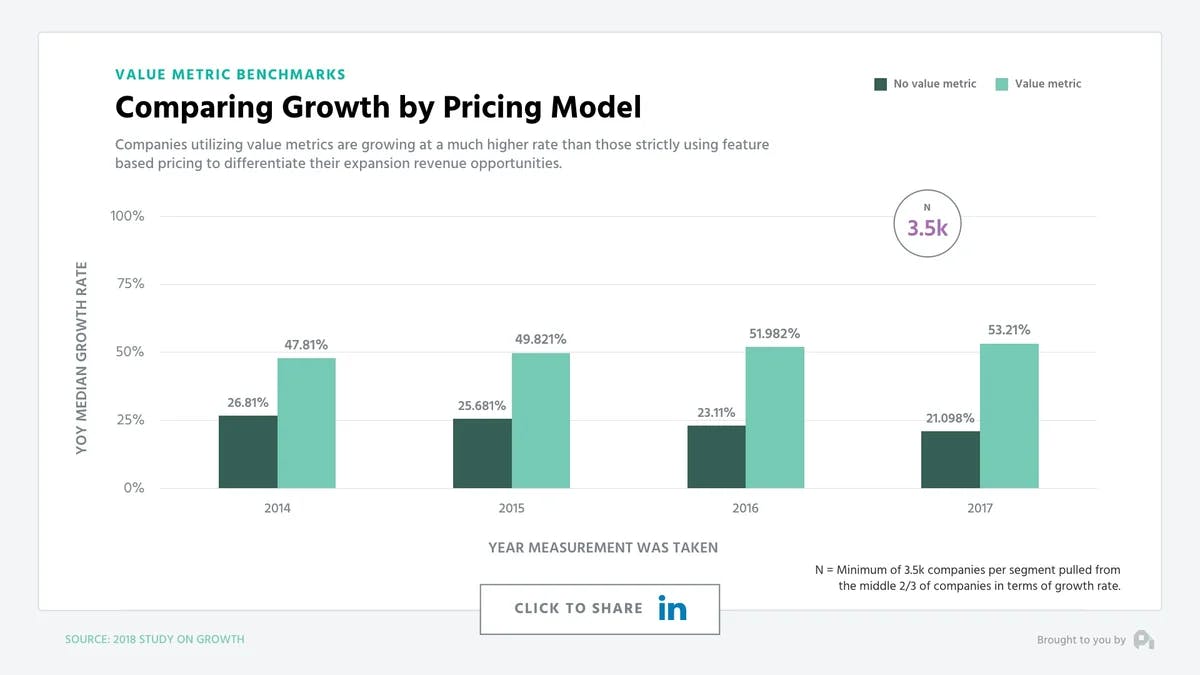
Growth Differential
This growth differential for value metric companies is because you’re baking expansion revenue directly into your pricing model. If you’ve aligned your value metric correctly with your target customer base, then as they use more of that metric, they’ll naturally be inclined to pay more, because they’re getting more value. Plus, you won’t have to fight tooth and nail to convince them to upgrade for a feature they probably don’t need.
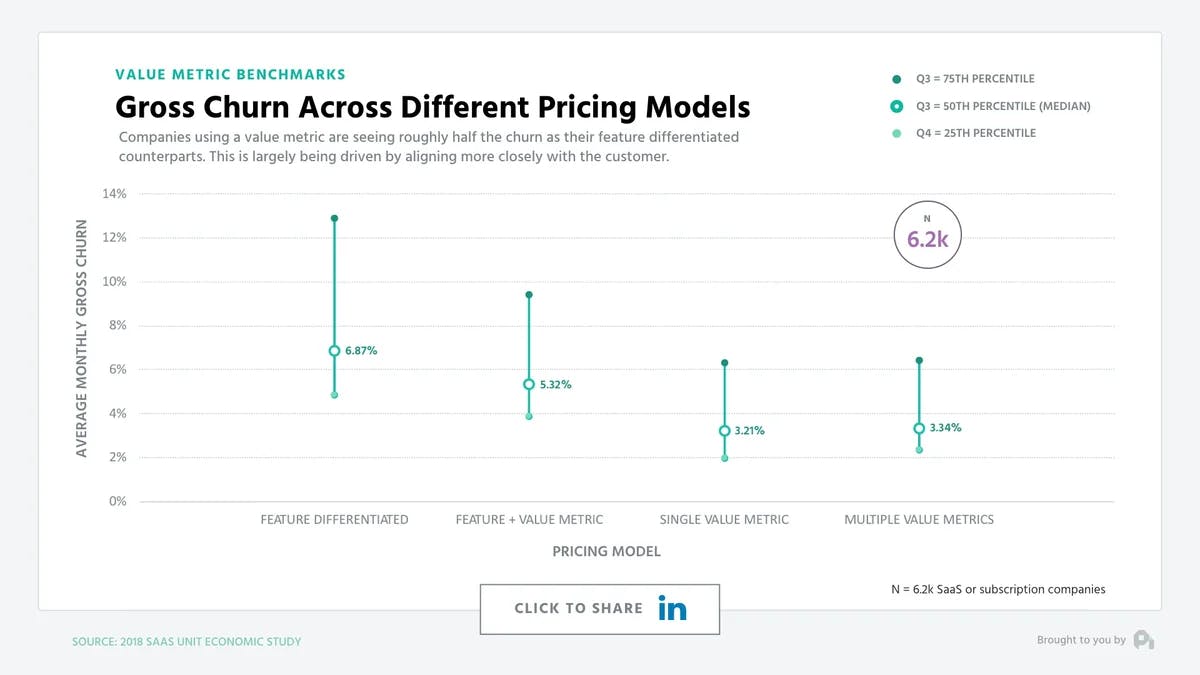
Gross logo churn rates of those companies who are utilizing a value metric are actually half those of those pricing based on feature differentiation.
Gross Churn Across Different Pricing Models
Plus, just raw expansion revenue as a proportion of overall revenue is higher - with value metric companies seeing roughly 10 to 25% higher expansion revenue on an absolute basis.
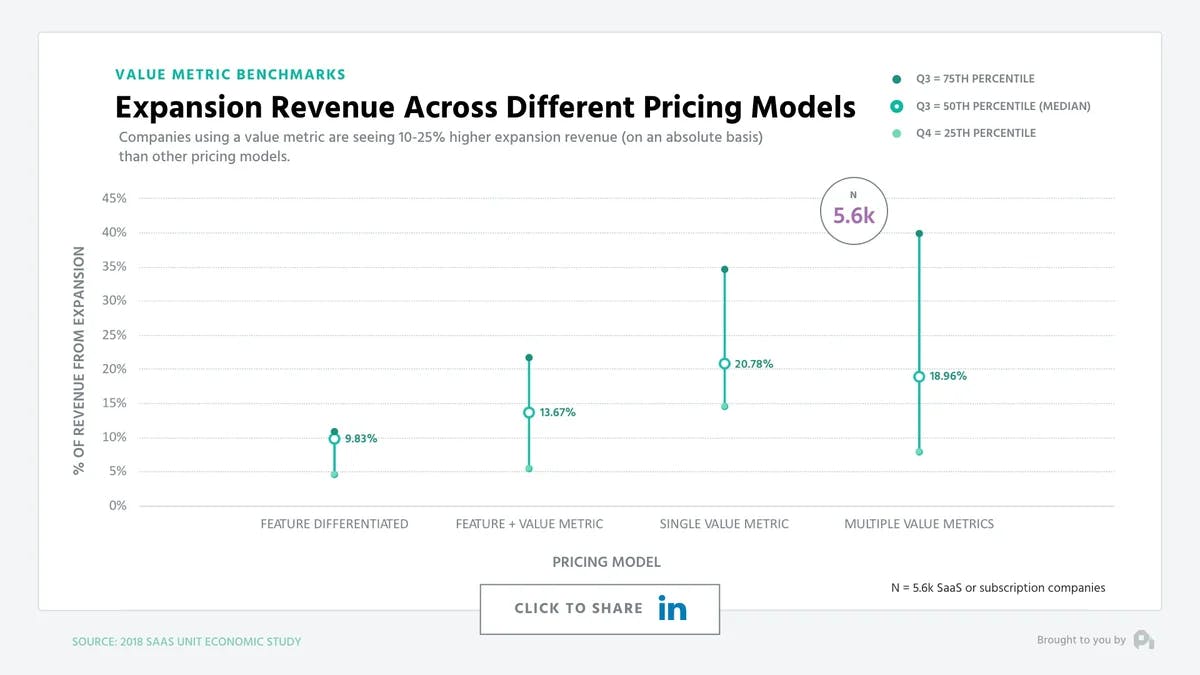
Signs You Have the Right Value Metric
Clearly a value metric is the way to go, but what are some signs you’ve hit the right one? First, I’d make sure you’re seeing this type of throughput from an expansion revenue perspective. If you’re seeing less than 15% of your revenue from expansion, you’re probably using the wrong metric.
Ultimately, the beauty of the subscription model is that with more and more technology coming into the billing mix, we now have the ability to fulfill the dream of commerce, which is to bake the relationship of our users directly into our pricing model, allowing a symbiosis to germinate and grow as that user continues to be nurtured by the value we’re providing.
Want to learn more? Check out our recent episode: How Discounts Impact Retention and subscribe to the show to get new episodes.
1
00:00:00,320 --> 00:00:03,060
You've got the questions,
and we have the data.
2
00:00:03,680 --> 00:00:04,240
Each week,
3
00:00:04,240 --> 00:00:07,440
we dive deep on benchmarks
of the subscription economy that
4
00:00:07,440 --> 00:00:09,375
you just can't get any else?
5
00:00:10,795 --> 00:00:13,375
This is the profit well report.
6
00:00:14,635 --> 00:00:17,810
Yo Patrick, it's zero
with publicity dot ai. Curious.
7
00:00:17,810 --> 00:00:21,330
What are the best practices
for pricing your SaaS offer in
8
00:00:21,330 --> 00:00:22,930
today's landscape? Zeal,
9
00:00:22,930 --> 00:00:26,050
that's an amazing backdrop
and also an amazing question
10
00:00:26,050 --> 00:00:30,195
because it gets to one of my
favorite topics of all time, value metrics.
11
00:00:30,195 --> 00:00:31,955
Value metrics are
what you charge for,
12
00:00:31,955 --> 00:00:34,435
where it could be some measure
of usage, some per user
13
00:00:34,435 --> 00:00:37,380
pricing, or even a cut of
cash made from a product.
14
00:00:37,380 --> 00:00:38,660
So to answer Zeeel's question,
15
00:00:38,660 --> 00:00:41,300
we looked at over six
thousand companies and data from nearly
16
00:00:41,300 --> 00:00:43,380
six hundred thousand
subscriber buyers,
17
00:00:43,380 --> 00:00:45,205
and here's what
we found. For one,
18
00:00:45,205 --> 00:00:48,005
it's hard to deny the impact
of value metrics on a business,
19
00:00:48,005 --> 00:00:49,845
particularly when
it comes to growth.
20
00:00:49,845 --> 00:00:53,090
When we compare companies
utilizing some value metric to
21
00:00:53,090 --> 00:00:56,210
those who are strictly
using feature differentiated pricing,
22
00:00:56,210 --> 00:00:58,770
those who use a value
metric are growing at nearly double
23
00:00:58,770 --> 00:01:01,155
the rate as their feature
differentiated counterparts.
24
00:01:01,155 --> 00:01:02,595
And the gap is widening.
25
00:01:02,595 --> 00:01:04,995
The growth differential for
value metric companies is
26
00:01:04,995 --> 00:01:08,115
because you're baking expansion
revenue directly into your
27
00:01:08,115 --> 00:01:10,950
pricing If you've aligned
your value metric correctly with
28
00:01:10,950 --> 00:01:12,310
your target customer base,
29
00:01:12,310 --> 00:01:14,230
then as they use
more of that metric,
30
00:01:14,230 --> 00:01:17,485
they're naturally inclined to
pay you more because they're
31
00:01:17,485 --> 00:01:18,925
getting more value. Plus,
32
00:01:18,925 --> 00:01:21,085
you won't have to fight tooth
and nail to convince them to
33
00:01:21,085 --> 00:01:23,645
upgrade for a feature
they probably don't need.
34
00:01:23,645 --> 00:01:26,530
Gross logo churn rates of
those companies who are utilizing a
35
00:01:26,530 --> 00:01:29,810
value metric are actually
half those of feature differentiated
36
00:01:29,810 --> 00:01:33,385
pricing models plus just
raw expansion revenue proportion of
37
00:01:33,385 --> 00:01:36,265
overall revenue was higher
with value metric companies seeing
38
00:01:36,265 --> 00:01:38,825
roughly ten to twenty
five percent higher expansion
39
00:01:38,825 --> 00:01:40,905
revenue on an absolute basis.
40
00:01:40,905 --> 00:01:43,200
Clearly, a vow you
metric is the way to go,
41
00:01:43,200 --> 00:01:46,320
but what are some signs you've
hit the right one? First,
42
00:01:46,320 --> 00:01:48,720
I'd make sure you're seeing
this type of throughput from an
43
00:01:48,720 --> 00:01:50,215
expansion revenue perspective.
44
00:01:50,215 --> 00:01:52,455
If you're seeing less than
fifteen percent of your revenue
45
00:01:52,455 --> 00:01:56,455
from expansion, you're probably using
the wrong value metric. Ultimately,
46
00:01:56,455 --> 00:01:58,920
the beauty of the subscription
model is that with more and
47
00:01:58,920 --> 00:02:01,080
more technology coming
into the billing mix,
48
00:02:01,080 --> 00:02:03,800
we now have the ability to
fulfill the dream of commerce,
49
00:02:03,800 --> 00:02:06,440
which has debate the
relationship of our users
50
00:02:06,440 --> 00:02:08,115
directly to our pricing model,
51
00:02:08,115 --> 00:02:11,075
allowing a symbiosis to
germinate and allowing those
52
00:02:11,075 --> 00:02:14,230
customers to grow as you
continue to provide them more you.
53
00:02:14,230 --> 00:02:16,390
Well, that's all for now.
If you have any questions,
54
00:02:16,390 --> 00:02:19,270
shoot me an email or video
to p c at profitable dot com.
55
00:02:19,270 --> 00:02:21,590
Let's also thank Zeal
for sparking this research by
56
00:02:21,590 --> 00:02:24,395
clicking the below to share on
LinkedIn to give him a nice
57
00:02:24,395 --> 00:02:26,655
little shout out. We'll
see you next week.
58
00:02:29,115 --> 00:02:32,500
This episode of the Proposal Report
is brought to you by GoSquared,
59
00:02:32,500 --> 00:02:36,820
intelligent software to convert
clothes and delight customers,
60
00:02:36,820 --> 00:02:38,280
GoSquared dot com.

Get the latest episodes straight to your inbox