
Expansion Revenue is Your Lifeblood
This episode might reference ProfitWell and ProfitWell Recur, which following the acquisition by Paddle is now Paddle Studios. Some information may be out of date.
Originally published: March 28th, 2018
Expansion revenue is the lifeblood of a successful subscription business, particularly when it comes to looking at growth.
On this episode of the ProfitWell Report, Fred Stevens-Smith, CEO and Co-founder of Rainforest QA asks us to dive into the data around expansion revenue. To answer Fred's question, let’s look at the data from over 5,000 companies and 300,000 subscription consumers.
But first, if you like this kind of content and want to learn more, subscribe to get in the know when we release new episodes.

The Fuel for Efficient Companies
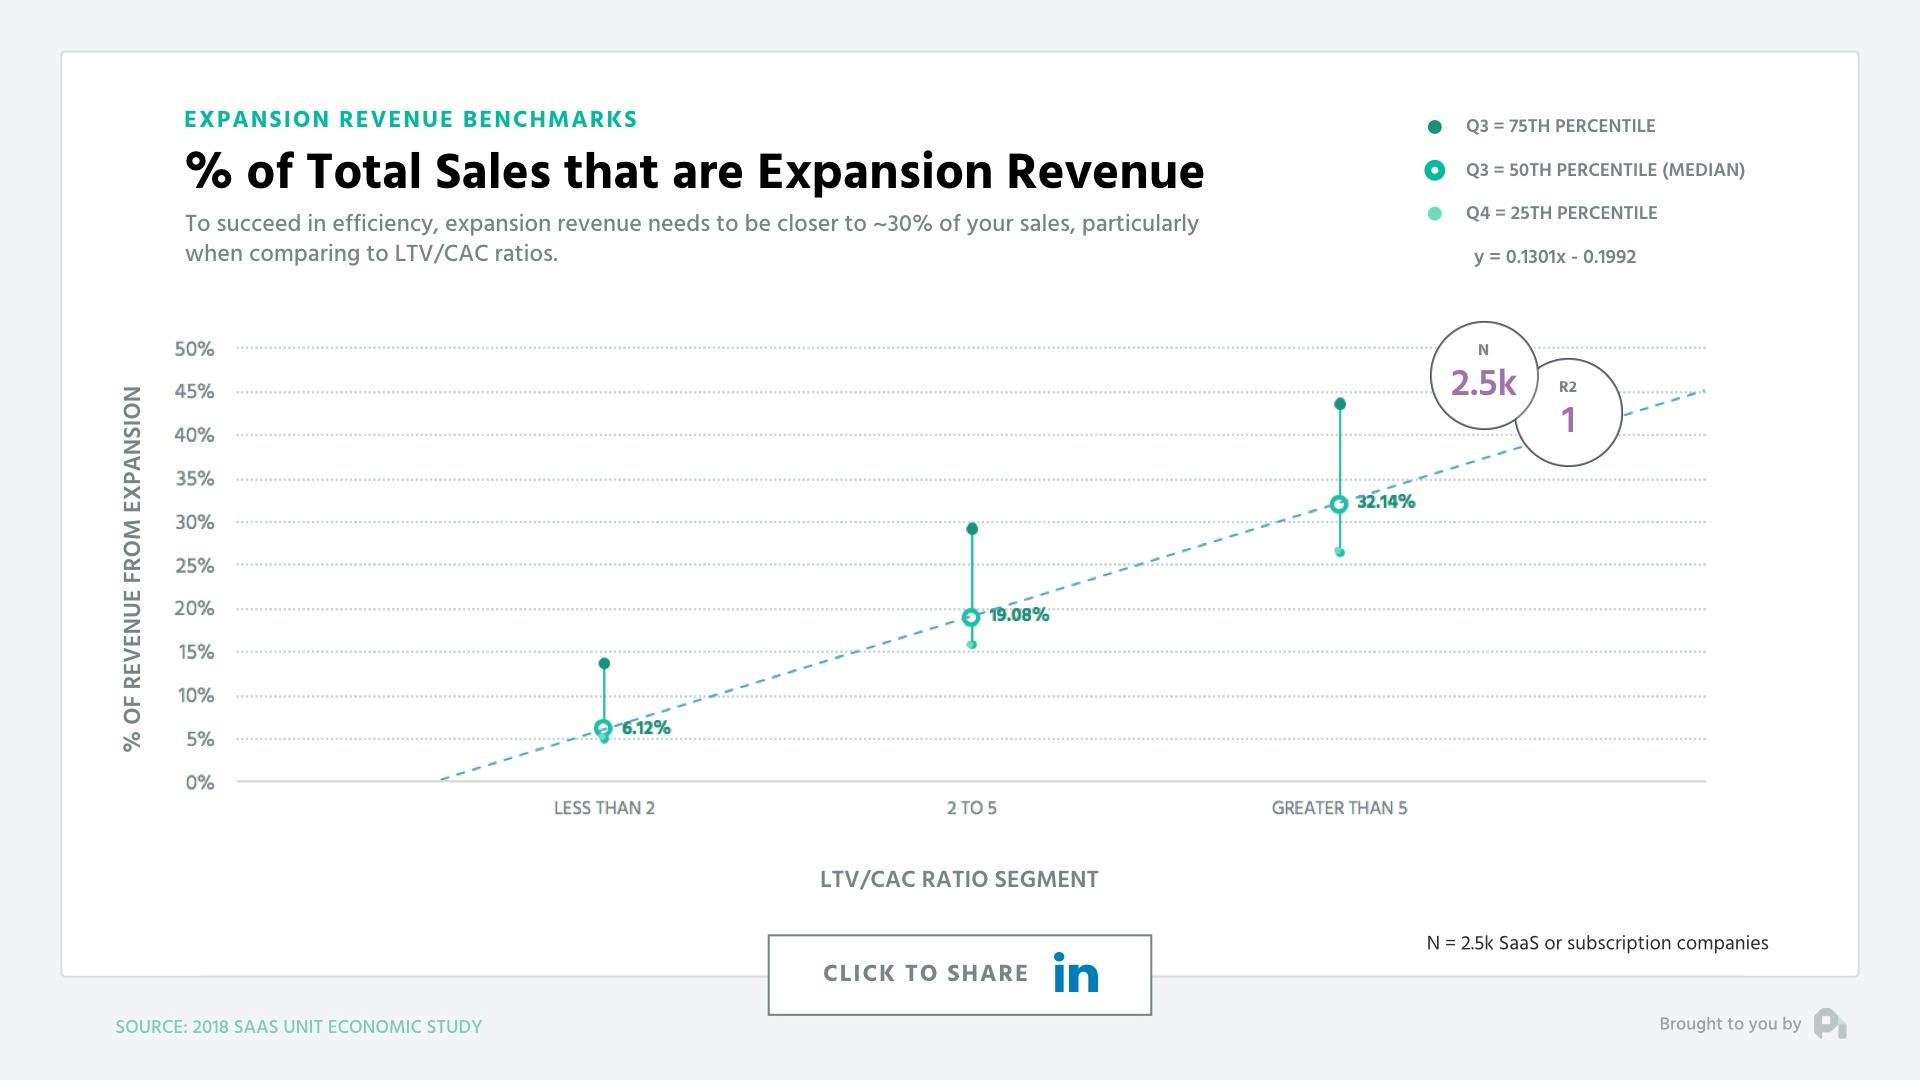
The most efficient companies when looking at LTV to CAC ratios are fueling that efficiency mainly off expansion revenue. Note that companies who have an LTV to CAC between three and five are seeing a median of just under 20% expansion revenue as a proportion of their total revenue. Those with an LTV to CAC above five are pushing above 30% in terms of expansion revenue.
Growth Cohort Compared to Expansion Revenue
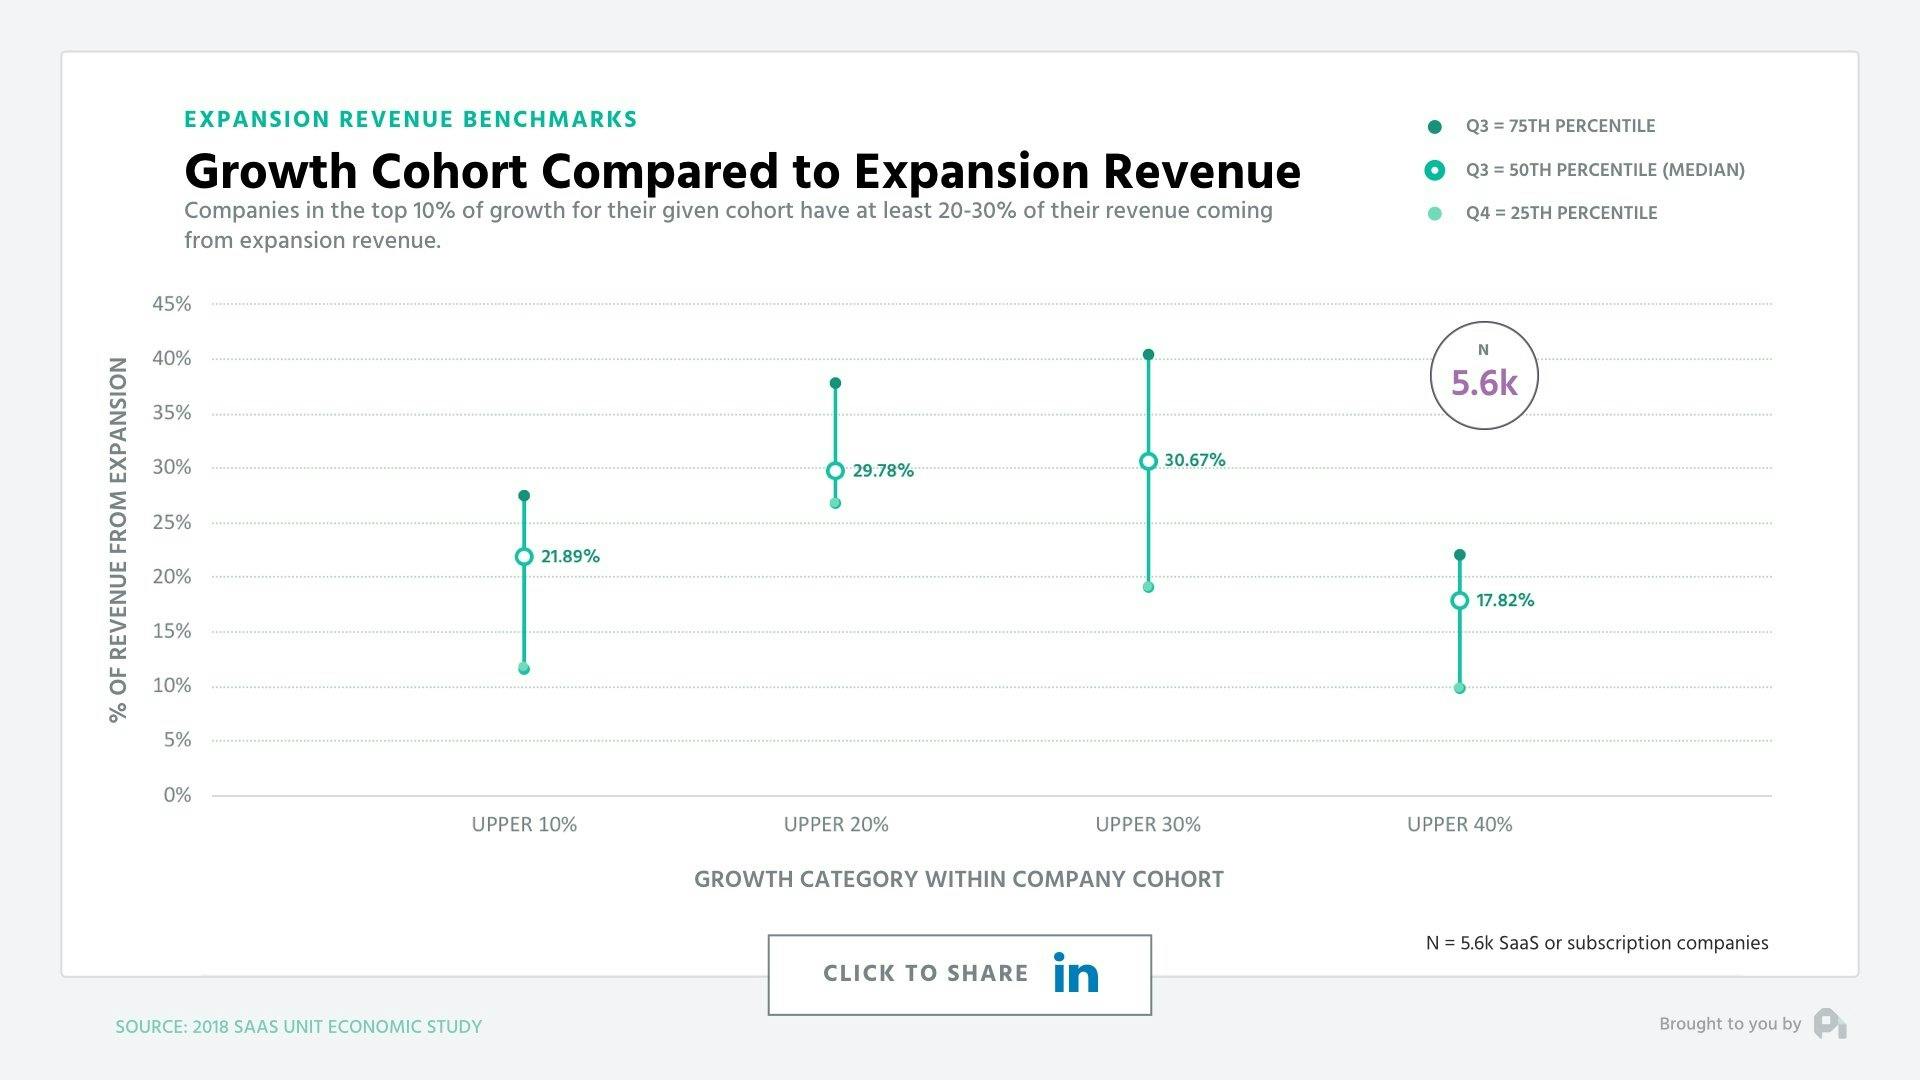
Efficiency doesn’t tell the whole story though. Growth is important, and if you’re efficient you’re not always investing in growth. Interestingly enough though, companies growing in the Top 40% of their cohorts are seeing at least roughly 20% of their revenue coming from expansion and a high end of nearly 40% expansion revenue.
How much more?
We’ve seen a good crop of externalities for companies who have cracked the 30% threshold when it comes to expansion revenue. ARPU tends to be growing at 2x the rate as those companies with expansion below that threshold. Revenue retention is typically net negative, and even gross churn is typically half.
Of course, this data is highly correlative, because to get proper expansion revenue at these levels, you need good pricing, good product, and ultimately to be using a value metric. Yet, 20 to 30 percent can act as a solid north star to benchmark your efforts going forward. That being said, the answer is probably still more, more, and more.
Want to learn more? Check out our recent episode: How Great Support Impacts Retention and subscribe to the show to get new episodes.
1
00:00:00,099 --> 00:00:02,699
You've got the questions, and we have the data
2
00:00:03,399 --> 00:00:09,119
Each week we dive deep on benchmarks of the subscription economy that you just can't get anywhere else
3
00:00:10,480 --> 00:00:13,230
This is the ProfitWell Report
4
00:00:15,850 --> 00:00:20,010
Yo, Patrick, it's Fred. As I sit here on my morning walk
5
00:00:20,529 --> 00:00:25,379
The top of Bernal Heights I find myself wondering what portion of my revenue
6
00:00:25,680 --> 00:00:28,940
should be up sell and expansion revenue?
7
00:00:28,940 --> 00:00:34,100
You're my kind of man Fred thinking of the subscription economy amongst nature, but to answer your question
8
00:00:34,200 --> 00:00:38,900
Let's look at the data from over 5,000 companies and 300,000 subscription consumers
9
00:00:39,340 --> 00:00:43,680
As to not bury the lede the answer is just straight up more more more MORE
10
00:00:44,140 --> 00:00:47,760
Expansion revenue is the lifeblood of a successful subscription business
11
00:00:48,180 --> 00:00:50,100
particularly when it comes to looking at growth.
12
00:00:50,110 --> 00:00:57,520
The most efficient companies were looking at an LTV 2 CAC ratio are actually fueling that efficiency mainly off of expansion revenue
13
00:00:57,640 --> 00:01:04,650
note that companies who have an LTV - CAC between 3 & 5 are seeing a median of just under 20 percent expansion revenue as
14
00:01:04,650 --> 00:01:06,490
a proportion of their total revenue
15
00:01:06,490 --> 00:01:13,979
those with an LTV - CAC above 5 are actually seeing 30 percent or more of their revenue coming from expansion that being said
16
00:01:14,229 --> 00:01:16,119
Efficiency doesn't tell the whole story
17
00:01:16,119 --> 00:01:17,340
Growth is important
18
00:01:17,340 --> 00:01:19,799
And if you're efficient you're not always investing in growth
19
00:01:20,100 --> 00:01:25,160
interestingly enough though companies growing in the top 40 percent of their cohorts are seeing at least
20
00:01:25,480 --> 00:01:31,600
roughly 20% of their revenue coming from expansion and a high-end of nearly 40 percent coming from expansion
21
00:01:31,600 --> 00:01:36,180
So to be blunt, more more and more is really an answer of at least 20%
22
00:01:36,340 --> 00:01:38,800
And you really should be shooting for closer to 30%
23
00:01:39,220 --> 00:01:40,750
We've seen a good crop of
24
00:01:40,750 --> 00:01:43,439
externalities for companies who have cracked this 30 percent threshold
25
00:01:43,659 --> 00:01:50,008
When it comes to expansion revenue ARPU tends to be growing at 2x the rate as those companies with expansion below that threshold
26
00:01:50,530 --> 00:01:56,219
Revenue retention is typically net-negative and even gross churn is typically half. Of course this data
27
00:01:56,219 --> 00:02:01,829
is highly correlative because to get proper expansion revenue with these levels you need good pricing good products and
28
00:02:01,930 --> 00:02:08,669
Ultimately you need to be using a value metric yet 20 to 30 percent can act as a solid North Star to benchmark your efforts
29
00:02:08,700 --> 00:02:12,160
That being said the answer is probably still more, more, and more.
30
00:02:12,320 --> 00:02:18,430
Well, that's all for now if you have a question ship me an email or video to PC@ProfitWell.com and let's also thank
31
00:02:18,430 --> 00:02:23,440
Fred for sparking this research by clicking on the link below to share on LinkedIn to give him a nice little shout-out
32
00:02:23,780 --> 00:02:25,780
We'll see you next week
33
00:02:27,530 --> 00:02:30,100
This episode of the ProfitWell Report is brought to you by
34
00:02:30,380 --> 00:02:35,079
Pricing Page Teardown where Patrick and Peter break down the pricing pages and strategies of
35
00:02:35,360 --> 00:02:43,179
Subscription companies from all corners of the market. Sign up right now to be notified as soon as a new episode is live

Get the latest episodes straight to your inbox


Caya from Slidebean on Mastering the Art of Startup Storytelling

B-Side: What a PE firm would do if they bought your company

Payrix’s Bob Butler on Finding Anchor Personas

The 6 Instruments to Keep Your Product Alive with DevSquad’s Phil Alves