Pricing for Bottom Line Growth
This episode might reference ProfitWell and ProfitWell Recur, which following the acquisition by Paddle is now Paddle Studios. Some information may be out of date.
Originally published: February 12th, 2018
Main Takeaways:
- Updating pricing quarterly can result in 2-4X higher ARPU.
- Monetization has nearly 8X the impact of acquisition.
- Companies spend less than 10 hours per year on pricing.
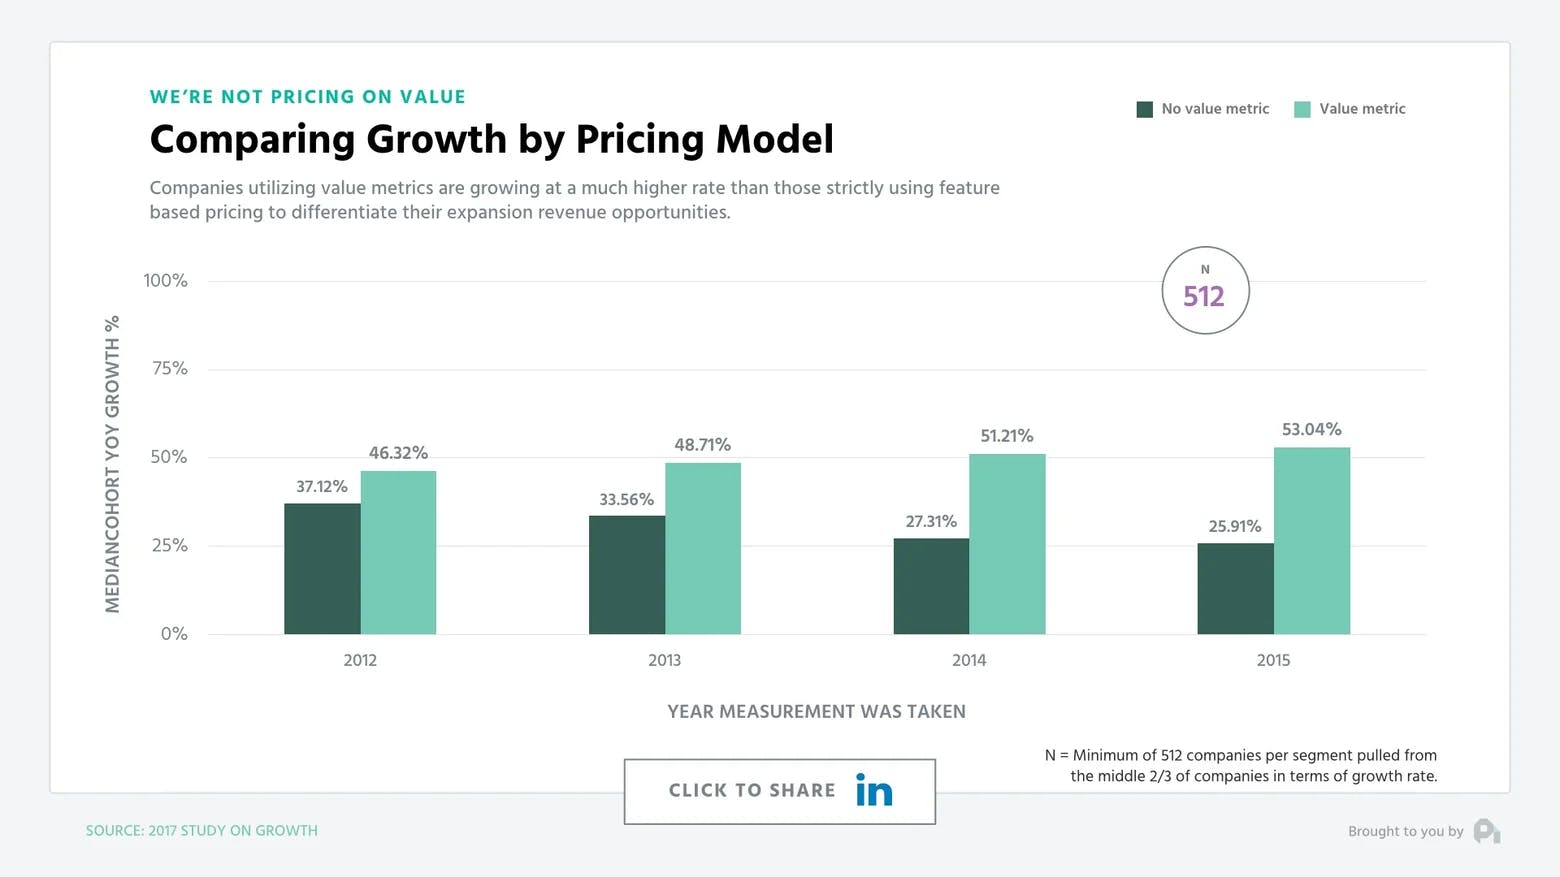
- Companies using a value metric grow 2X faster.
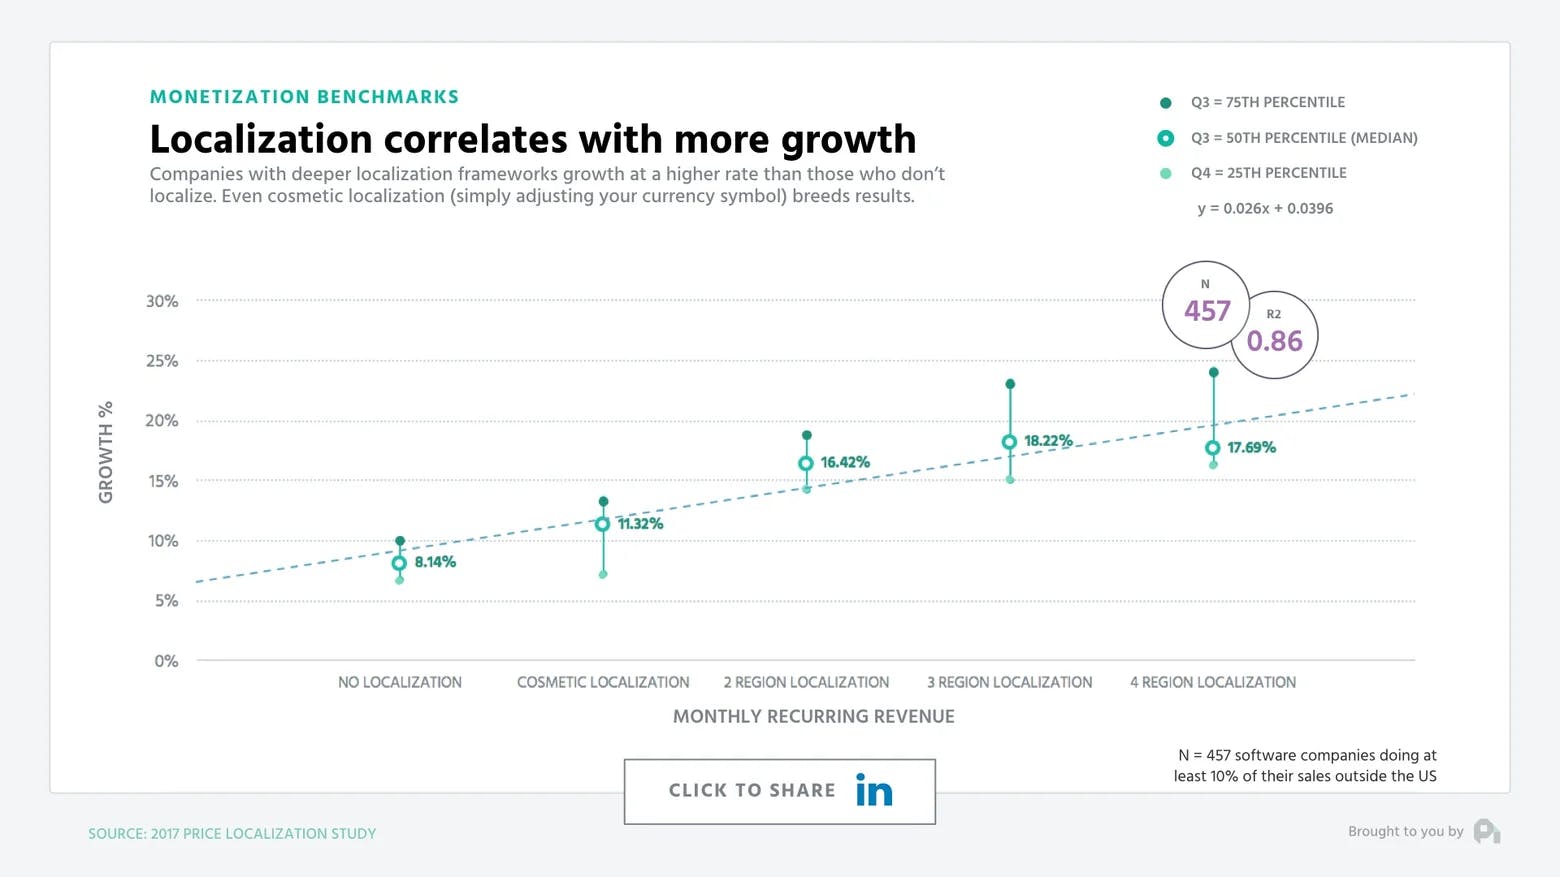
- Localizing pricing results in 25-50% higher growth rates.
Pricing remains one of the most important growth levers in business today, yet we still fail to spend the time and effort required to leverage monetization for growth.
On this episode of the ProfitWell Report, we set out to answer a question from Jeanne Hopkins, CMO at Ipswitch: How should you price to have the biggest impact on your bottom line?
Pricing is one of the most important growth levers in your business, so to answer Jeanne's questions, we're going to dig into the data from nearly five thousand companies and over one million transactions.
But first, if you like this kind of content and want to learn more, subscribe to get in the know when we release new episodes.

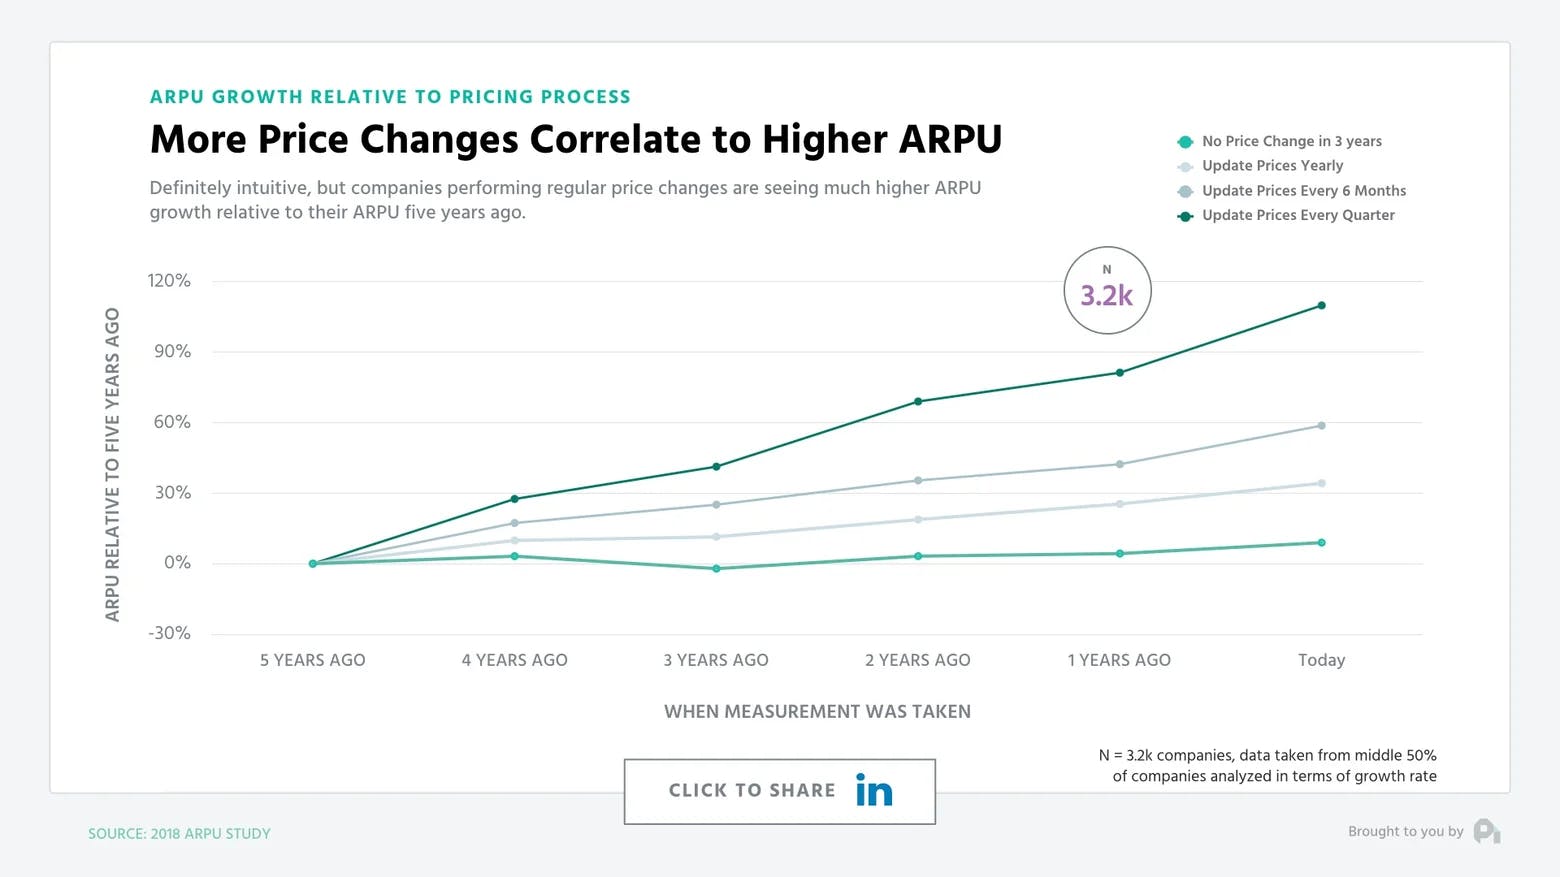
Pricing is a process of incremental gains
When comparing companies who regularly update their prices with those who don't, those companies updating their pricing at least once every 6 months are seeing nearly double the ARPU gain than those who upgrade their pricing only once per year or longer.
Your price is the exchange rate on the value you provide, so as your product and company improves, your price should be tracking alongside that improvement.
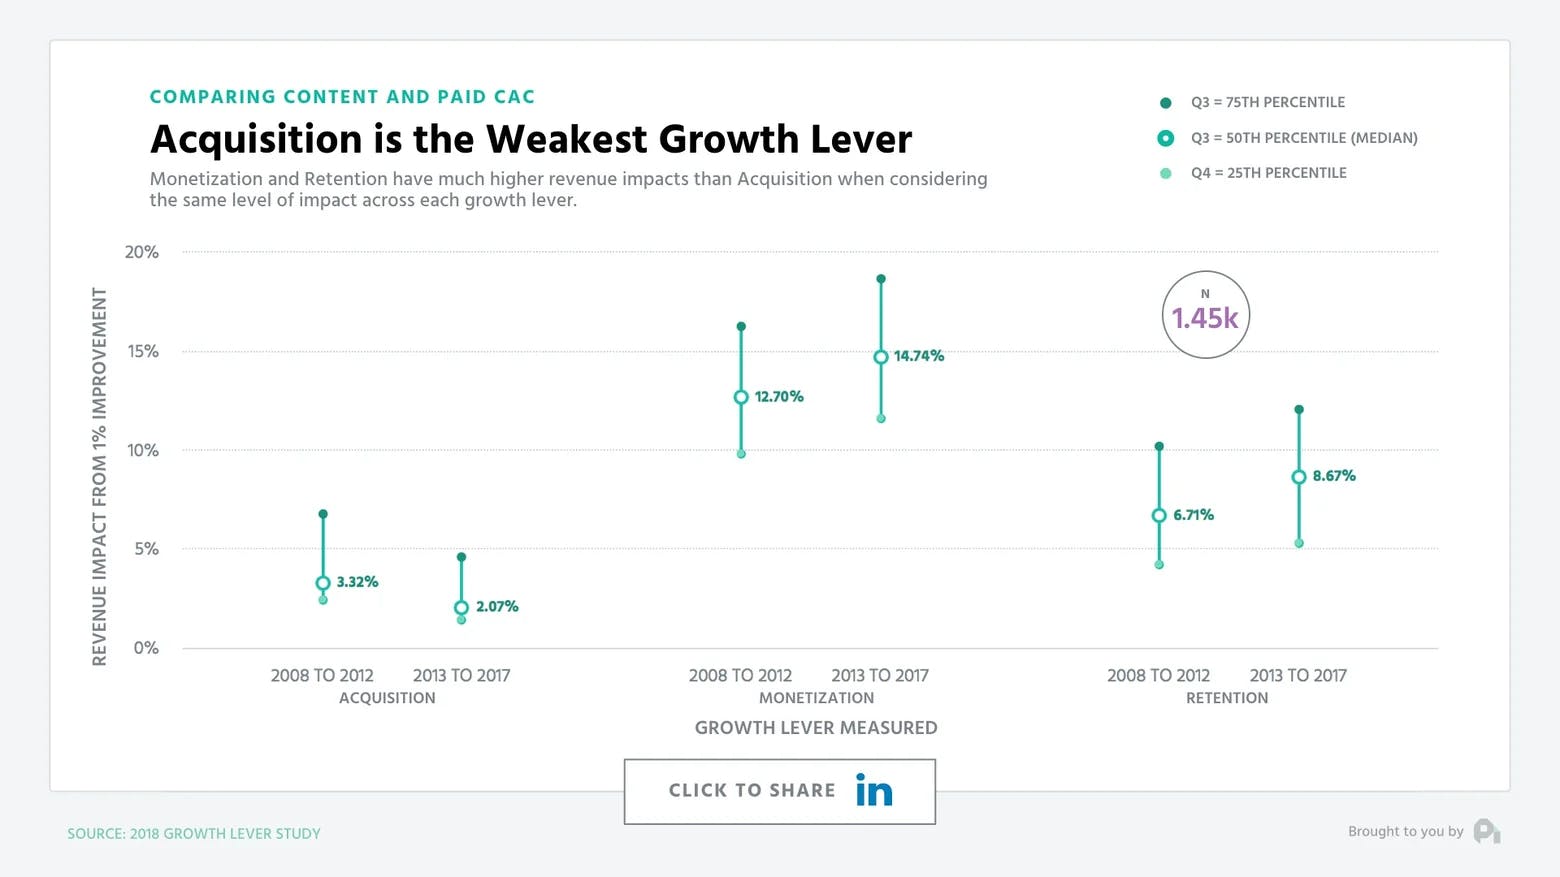
Impact of monetization on your bottom line
Similarly, when isolating and normalizing the microeconomic impact of improving your main growth levers, you'll find that Monetization has nearly 8x the impact of improving something like your acquisition.
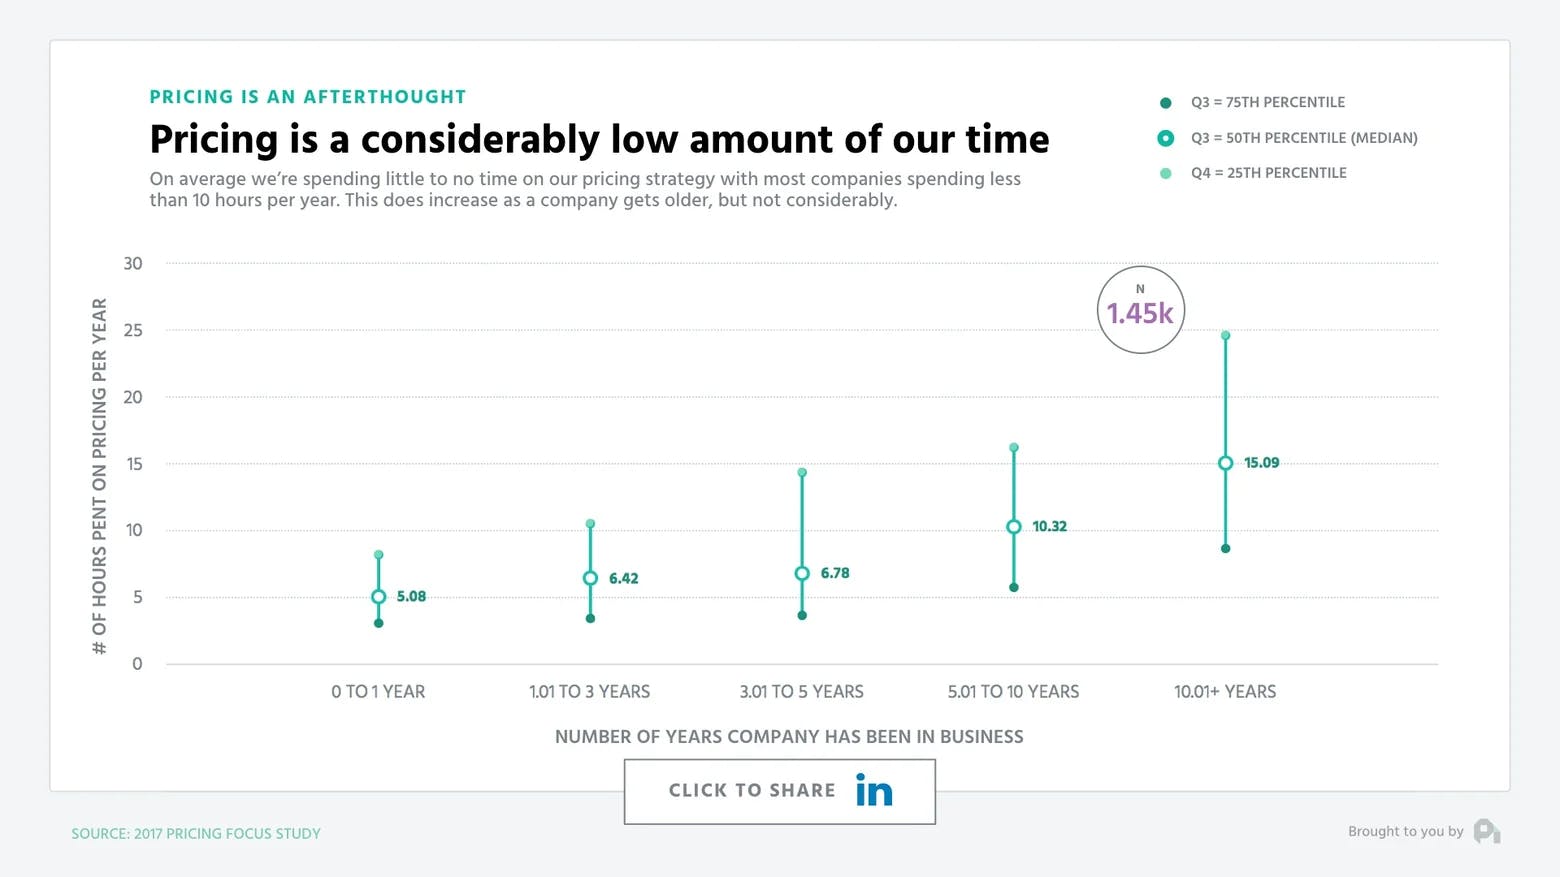
Amount of time companies spend on pricing
Here's the rub though. We don't historically care about pricing. The average amount of time a company spends per year on pricing is less than 10 hours. There's a multitude of reasons why this is the case - pressures to grow at all cost, significant knowledge gaps on how to price, and countless others.
Yet, there are some easy things you can focus on to ease yourself into high growth price optimization based on the data.
Unlocking growth by using a value metric
First, make sure you're using a value metric. A value metric is what you charge for - per seat, per 100 visits, per gigabyte, etc. Data indicates that those companies utilizing a value metric are growing at nearly double the rate of those who are merely feature differentiated, and the divide is widening. Plus, this bakes expansion revenue into your pricing model to make retention easier, as well.
Leveraging price localization for growth
Further, another quick win is to utilize price localization and internationalization, which means both updating your pricing cosmetically to use the currency symbol of the buyer, as well as updating the relative price of the product for the market density. This is a relatively easy way to quickly gain 25-50% higher growth rates.
We could go on for days - and we did in our 150 page book we wrote on pricing.
That's all for this week. Want to learn more? Check out our recent episode: 10,000 Blogs Show Content Marketing CAC is on the Rise and subscribe to the show to get new episodes.
1
00:00:00,320 --> 00:00:03,060
You've got the questions,
and we have the data.
2
00:00:03,680 --> 00:00:04,240
Each week,
3
00:00:04,240 --> 00:00:07,440
we dive deep on benchmarks
of the subscription economy that
4
00:00:07,440 --> 00:00:09,575
you just can't
get anywhere else.
5
00:00:10,835 --> 00:00:13,415
This is the profit well report.
6
00:00:15,770 --> 00:00:17,690
Hey, Patrick. I had
a quick question.
7
00:00:17,690 --> 00:00:21,690
What do you think about pricing when
you're trying to impact the bottom line?
8
00:00:21,690 --> 00:00:25,075
What's the best way to take
a look at great question.
9
00:00:25,075 --> 00:00:26,035
As some of you know,
10
00:00:26,035 --> 00:00:30,035
we can literally talk for
hours and probably days about this.
11
00:00:30,035 --> 00:00:32,595
Pricing is one of the most
important growth levers in your
12
00:00:32,595 --> 00:00:34,390
business. To answer
Jean's questions,
13
00:00:34,390 --> 00:00:36,950
we're going to dig into
the data from nearly five thousand
14
00:00:36,950 --> 00:00:39,590
different subscription
companies in over one million
15
00:00:39,590 --> 00:00:40,845
different trans patients.
16
00:00:40,845 --> 00:00:43,645
Pricing is a process
of incremental gains.
17
00:00:43,645 --> 00:00:46,365
So when we compare
companies who regularly update their
18
00:00:46,365 --> 00:00:48,450
prices, those who don't,
19
00:00:48,450 --> 00:00:51,810
those companies updating their pricing
at least once every six
20
00:00:51,810 --> 00:00:55,075
months are seeing nearly double
the ARPU gain than those who
21
00:00:55,075 --> 00:00:58,195
upgrade their pricing only
once per year or longer.
22
00:00:58,195 --> 00:01:01,875
Your price is the exchange rate
on the value that you provide.
23
00:01:01,875 --> 00:01:04,130
So as your product
and company improves,
24
00:01:04,130 --> 00:01:07,190
your price should be
tracking alongside that improvement.
25
00:01:07,730 --> 00:01:10,790
Similarly, when isolating
and normalizing the microeconomic
26
00:01:11,655 --> 00:01:13,815
of improving your
main growth levers,
27
00:01:13,815 --> 00:01:17,015
you'll find that monetization
has nearly eight times the
28
00:01:17,015 --> 00:01:20,470
impact of improving something
like your acquisition and it's
29
00:01:20,470 --> 00:01:24,630
only accelerating as time goes
on. Here's the rub though. We
30
00:01:24,630 --> 00:01:28,235
don't historically care as
a community about pricing.
31
00:01:28,235 --> 00:01:30,795
The average amount of time
a company spends per year on
32
00:01:30,795 --> 00:01:34,155
pricing is less than
ten hours in total.
33
00:01:34,155 --> 00:01:36,690
There's a lot of reasons
for this including things like
34
00:01:36,690 --> 00:01:38,130
pressures to grow at all costs,
35
00:01:38,130 --> 00:01:40,930
significant knowledge gaps
on how to price and just a
36
00:01:40,930 --> 00:01:44,935
multitude of others. But some easy
thing you can focus on to
37
00:01:44,935 --> 00:01:48,215
ease yourself into high growth
price optimization are based on
38
00:01:48,215 --> 00:01:50,055
the following data. First,
39
00:01:50,055 --> 00:01:52,280
make sure you're
using a value metric.
40
00:01:52,280 --> 00:01:54,120
Value metric is
what you charge for.
41
00:01:54,120 --> 00:01:57,000
It could be per seat, per
hundred visits, per gigabyte.
42
00:01:57,000 --> 00:01:59,560
And the data indicates
that those companies utilizing a
43
00:01:59,560 --> 00:02:02,665
value metric are growing at
nearly double the rate as those
44
00:02:02,665 --> 00:02:04,585
who are merely feature
differentiated,
45
00:02:04,585 --> 00:02:08,745
and the divide is widening
over time. Plus, this base expansion
46
00:02:08,745 --> 00:02:12,010
revenue right into your revenue
model to help with your overall
47
00:02:12,010 --> 00:02:13,530
retention as well. Further,
48
00:02:13,530 --> 00:02:16,890
another really quick win
is to utilize price localization,
49
00:02:16,890 --> 00:02:19,815
which means both updating your
price cosmetically to use the
50
00:02:19,815 --> 00:02:21,335
currency symbol of the buyer,
51
00:02:21,335 --> 00:02:24,455
as well as updating the
relative price of the product
52
00:02:24,455 --> 00:02:27,415
for the market density that
you're facing in that region.
53
00:02:27,415 --> 00:02:31,160
This is a relatively easy way
to quick gain twenty five to
54
00:02:31,160 --> 00:02:34,520
fifty percent higher growth
rates depending on your overall
55
00:02:34,520 --> 00:02:35,880
acquisition strategy.
56
00:02:35,880 --> 00:02:39,165
We could literally go on
for days about this data.
57
00:02:39,165 --> 00:02:41,725
And we actually did in our
hundred and fifty page book we
58
00:02:41,725 --> 00:02:43,805
wrote on pricing that's
in the show notes,
59
00:02:43,805 --> 00:02:45,320
but that's all for now.
60
00:02:45,320 --> 00:02:48,760
If you want us to dig further into
this data or any other data out there,
61
00:02:48,760 --> 00:02:51,800
ship me an email or video to
p c at profitable dot com.
62
00:02:51,800 --> 00:02:54,785
And let's also be sure to
thank Jean for sparking this research
63
00:02:54,785 --> 00:02:57,505
by clicking the tweet in the
link below to give her a shout
64
00:02:57,505 --> 00:02:59,765
out. We'll have more
data for you next week.
65
00:03:02,700 --> 00:03:05,020
This episode of the profitable
report is brought to you by
66
00:03:05,020 --> 00:03:08,300
Wistia. Better video hosting
that's built for business,
67
00:03:08,300 --> 00:03:09,840
wistia dot com.