
Welcome back to the ProfitWell SaaS Market Report! It’s been a while since we’ve shared a report (we’ve shifted to a quarterly cadence to bring you deeper analyses and stronger insights) but in the meantime, the SaaS market certainly has not stood still.
Instead, Q1 has brought us many, many ups and downs (well, mostly downs if we’re being honest).
So, what happened? Is there hope for a stronger Q2? Let’s jump into the data and get to the bottom of things… 👇
This is the latest in our ongoing SaaS Market Reports, which track the movement of the ProfitWell Subscription Index, and its underlying growth and retention trends. This time, we examine Q1 2025 performance.
B2B stumbles, climbs slowly from holiday dip
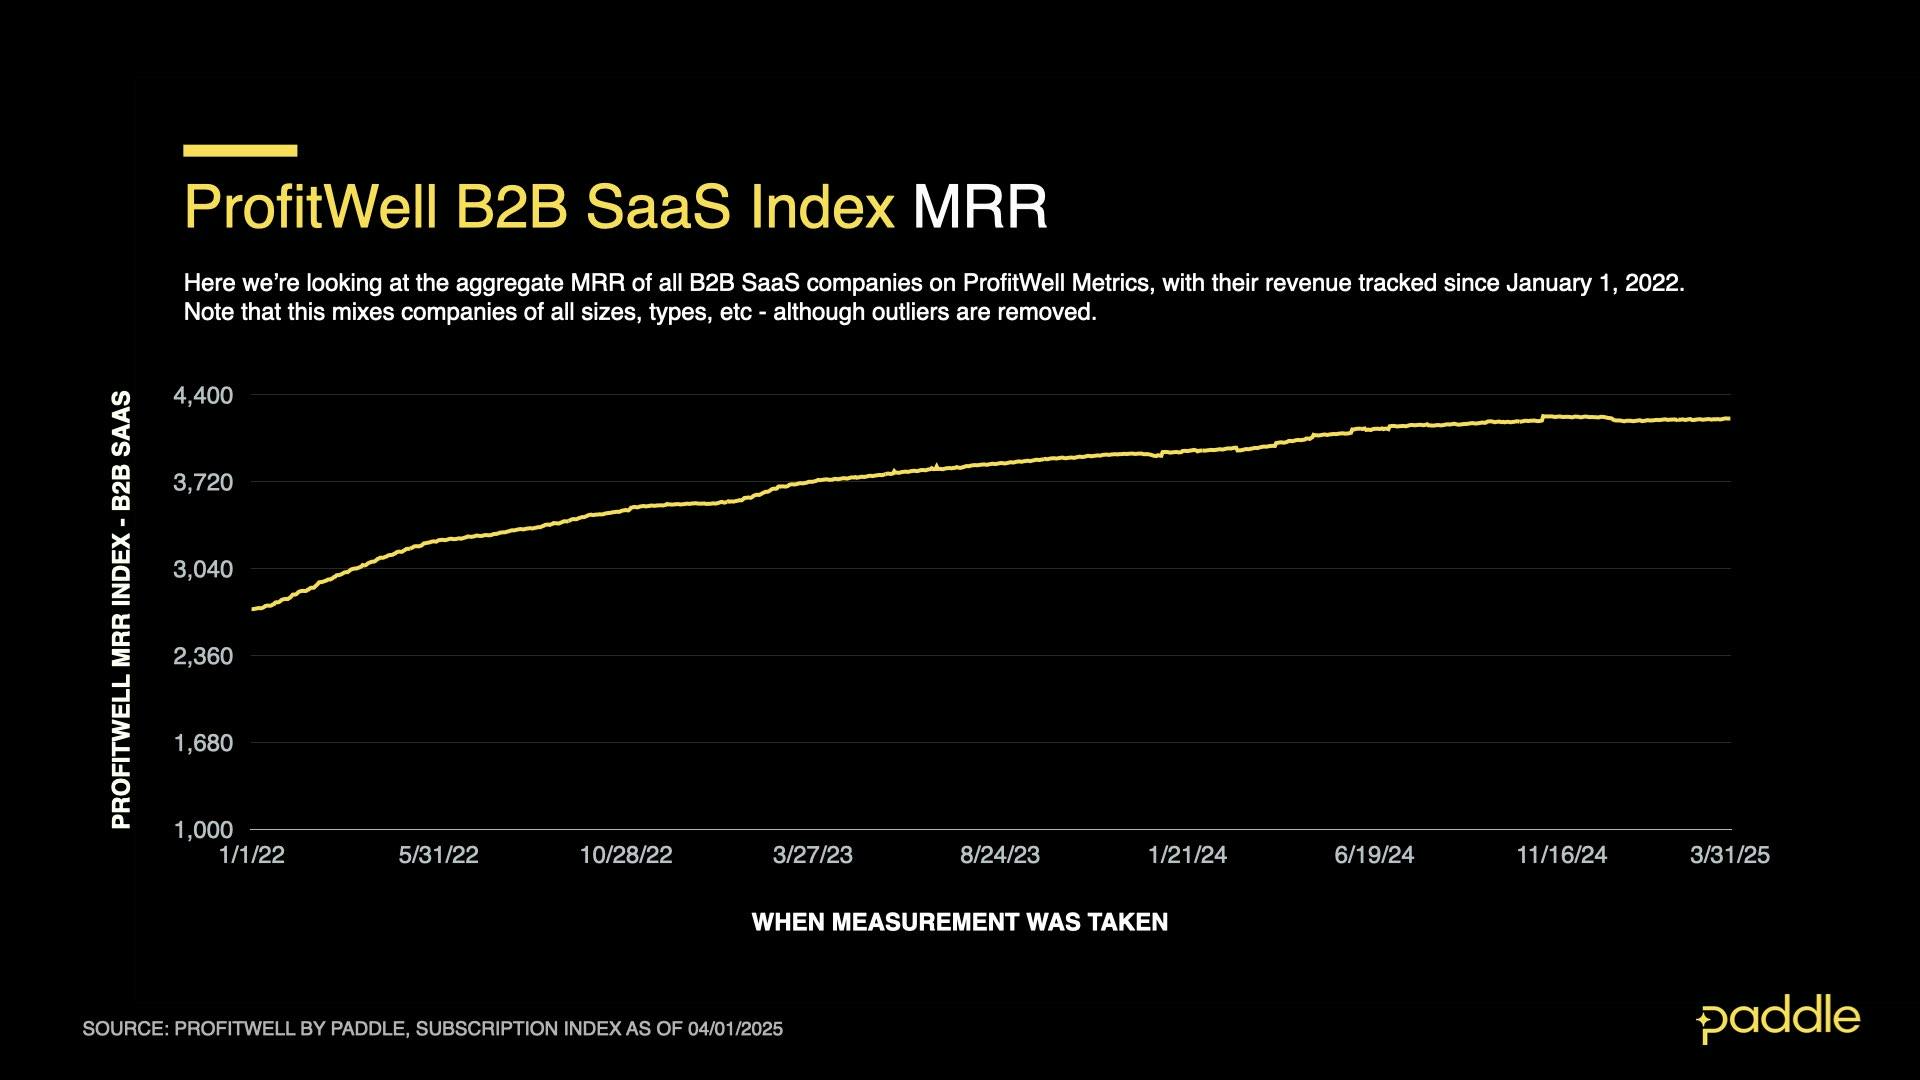
The ProfitWell B2B SaaS Index tracks the cumulative monthly recurring revenue (MRR) from a sample of the 34,000+ companies on ProfitWell Metrics. By measuring the revenue performance of this cross-section of companies over time, we can objectively observe how quickly the sector is growing (or not). The index does not adjust for inflation. Explore the free demo of ProfitWell Metrics here.
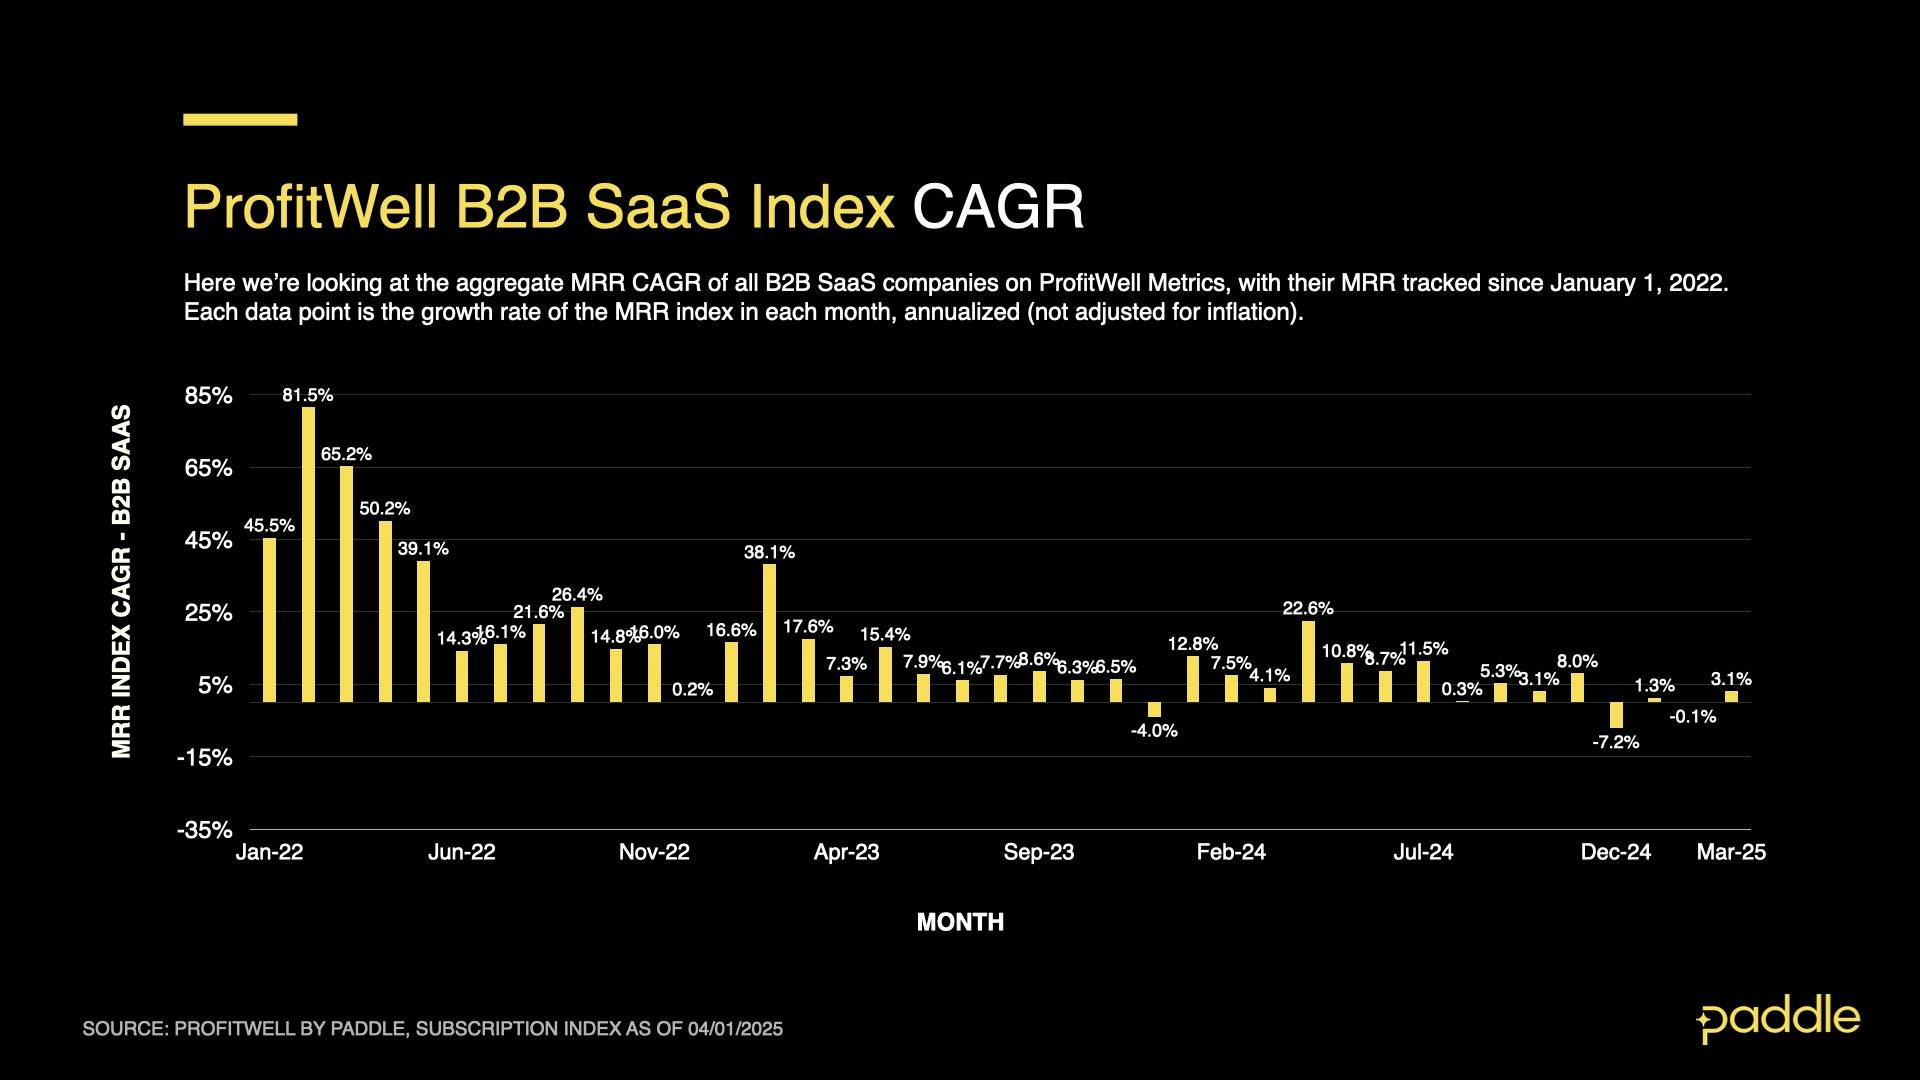
B2B SaaS growth fell dramatically in the first quarter of 2025. While a temporary, three-week dip over the winter holidays was to be expected, revenue growth remained stubbornly low throughout February and March as well, with monthly average compound annual growth rates (CAGR) of -0.1% and 3.1%, respectively.
This sets a bleak new record for B2B SaaS – for the first time in the six-year lifespan of the ProfitWell MRR Index, gross revenue across B2B SaaS Index companies failed to recover to pre-holiday levels, by the end of the quarter.
Examining the MRR index (aggregating gross revenue across all Profitwell B2B index companies), we can see the typical impact of the winter holidays. As employees took time off and new SaaS deals were put on hold, the index dropped to a low of 4192 in the second week of January, down from 4225 in mid-December.
Typically, the second half of January brings a complete recovery in gross revenue, but this year only saw a meager, 8-point increase to 4200 on the MRR Index by the end of the month; and an even slower climb to 4212 by the end of the quarter - still 13 points shy of B2B’s pre-holiday gross revenue.
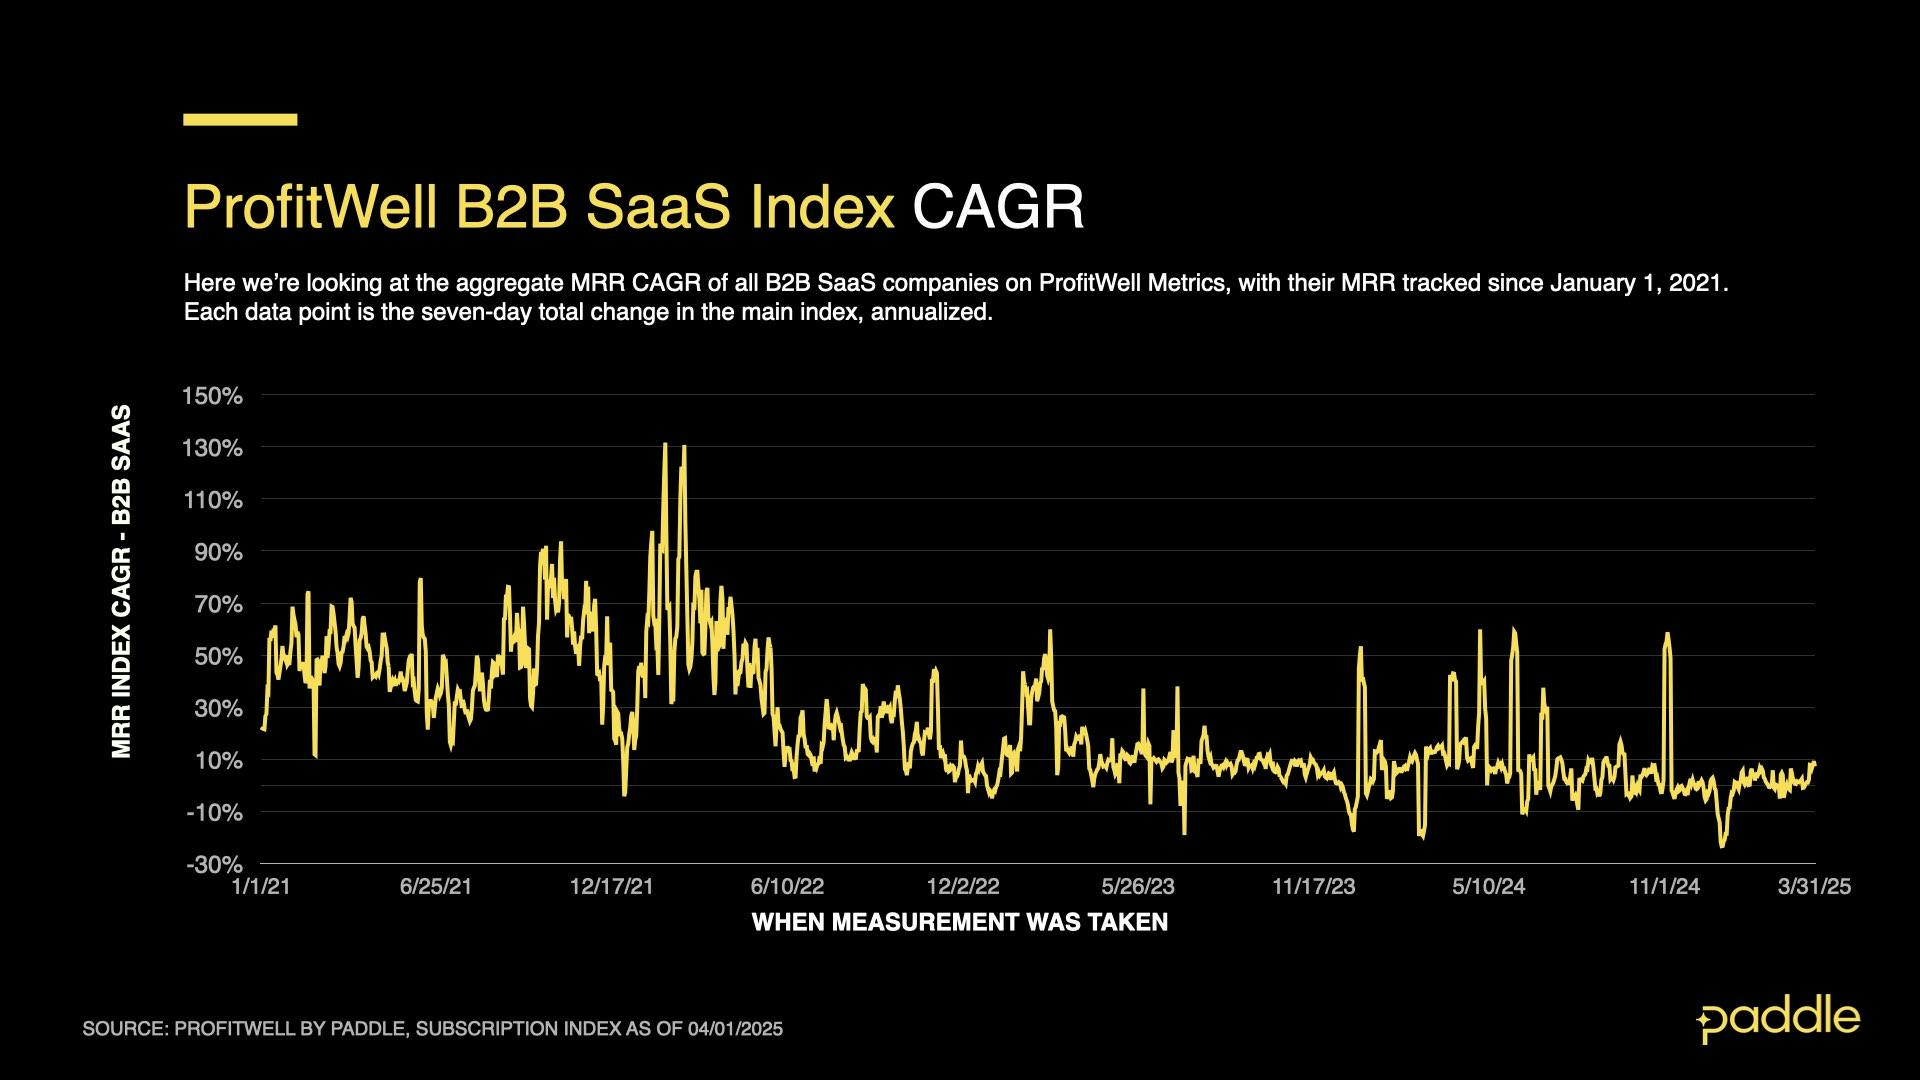
By examining revenue growth rates for B2B SaaS, we can pinpoint exactly where B2B growth began to stall. Between Christmas and New Year, CAGR temporarily dropped to -23.4%, its largest holiday dip since we began the index in 2019 (previous holiday seasons saw CAGR drop to -17.8%, and -5.0% respectively).
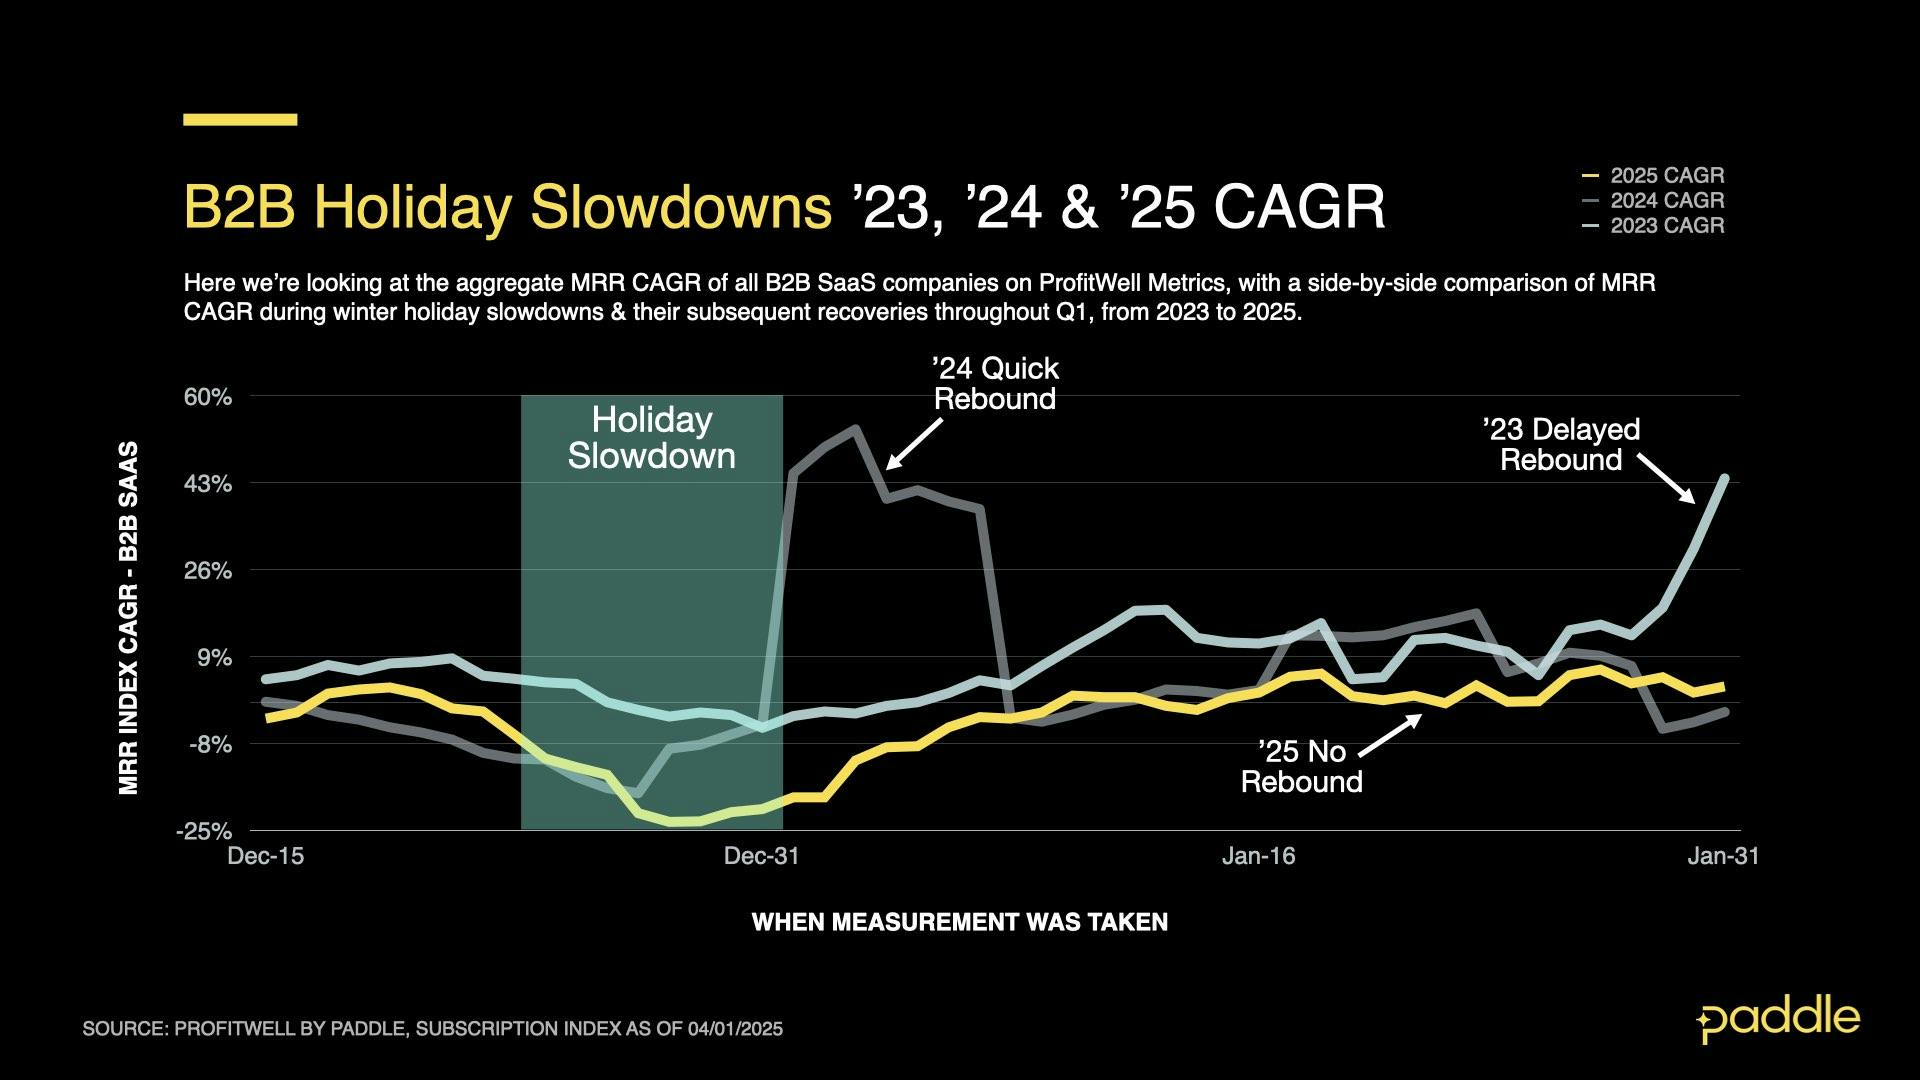
While unusually large, this dip wasn’t what caused the “damage” to B2B revenues – instead, it was the fact that revenue growth never fully rebounded after the holidays, when employees returned to work. This year, CAGR only increased by 8.5% between December and January, compared to a 16.8% increase in 2024 and 2023.
Worse yet, the lacklustre growth continued into February and March, with CAGR averaging -0.1% and 3.1% respectively. This erased any opportunity for B2B’s gross revenue to fully recover from the holiday slowdown.
Return of the churn...
So, why was this year’s holiday slowdown so large, and recovery so sluggish? Looking at the driving forces of B2B revenue growth: new sales & churn; and to a lesser extent, upgrades & downgrades, we can see exactly where the wheels began to come off.
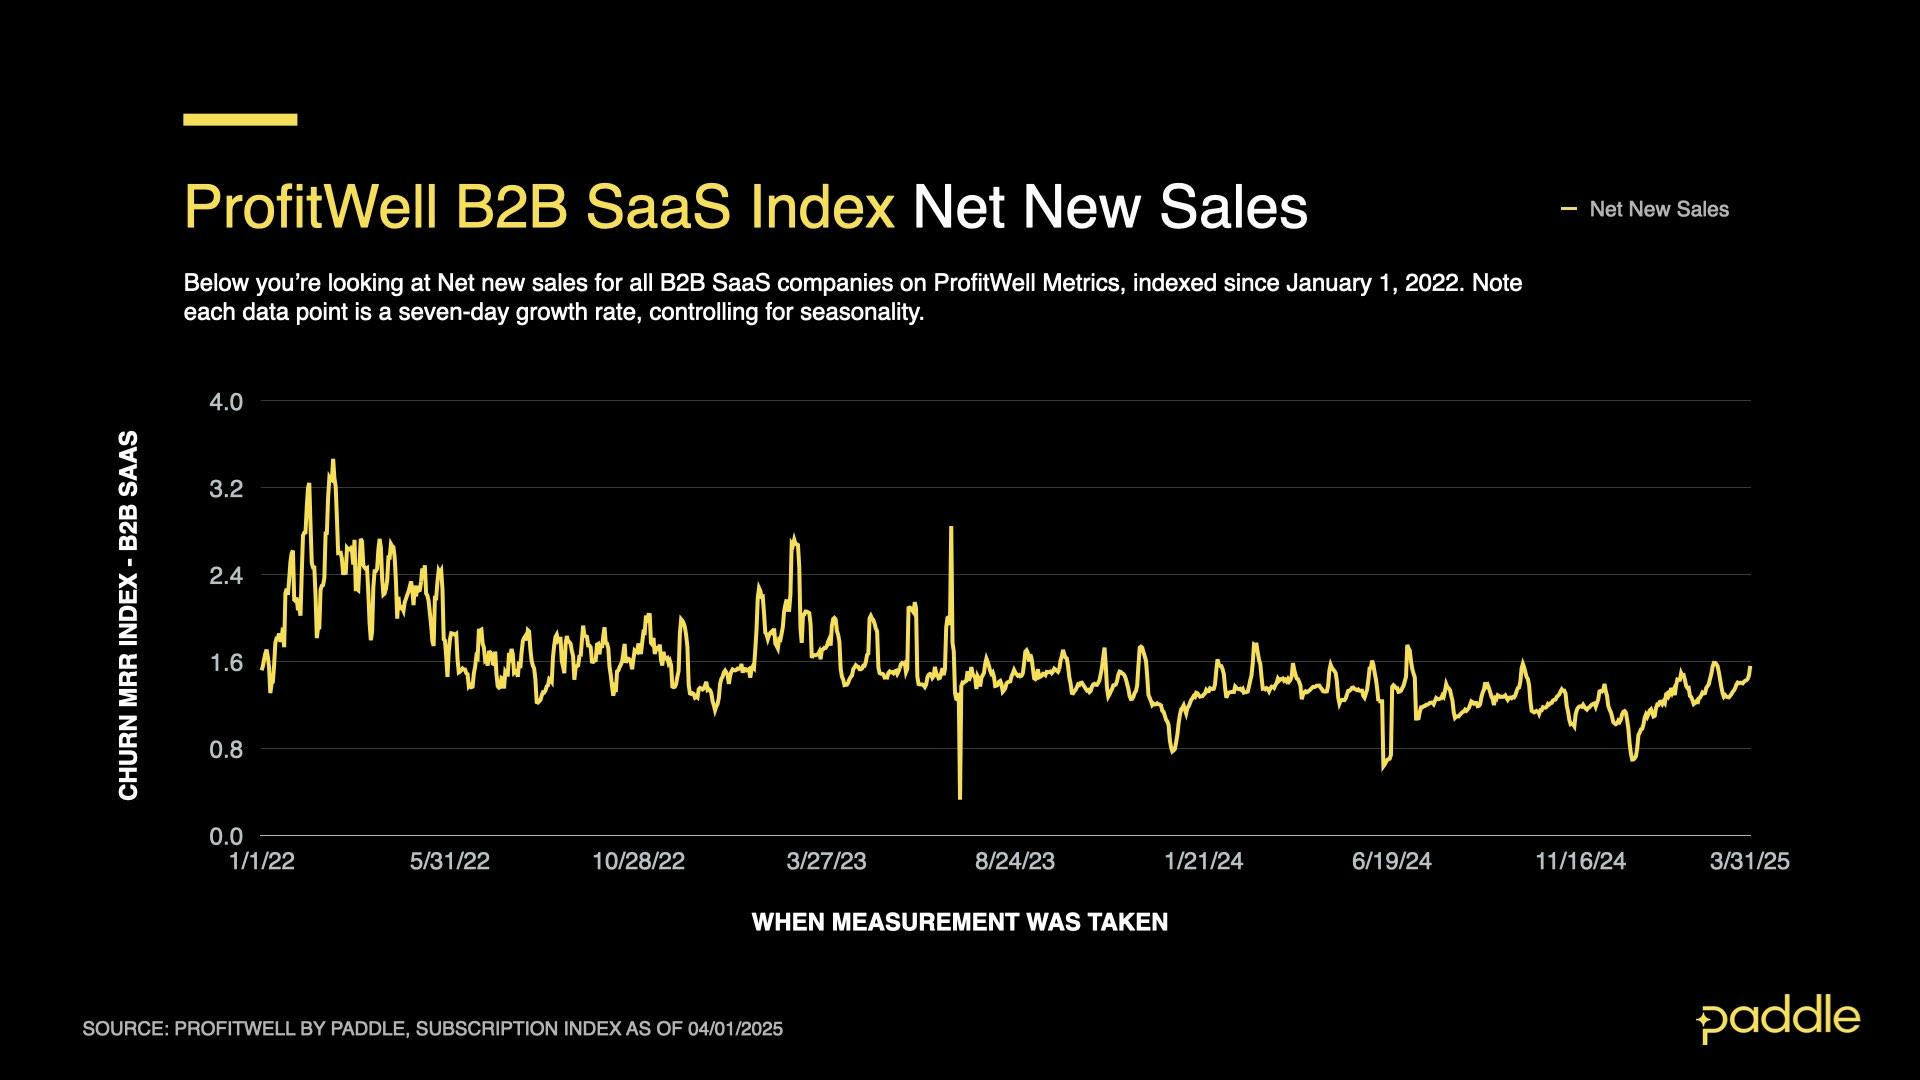
Coming out of this year’s holiday slowdown, our Profitwell New Sales Index actually showed strong growth, increasing by 10% in Q1 to an average value of 1.409.
This was a decent showing compared to Q1 new sales growth in 2024 (1.4%) and 2023 (14%), meaning sluggish sales were NOT the problem.
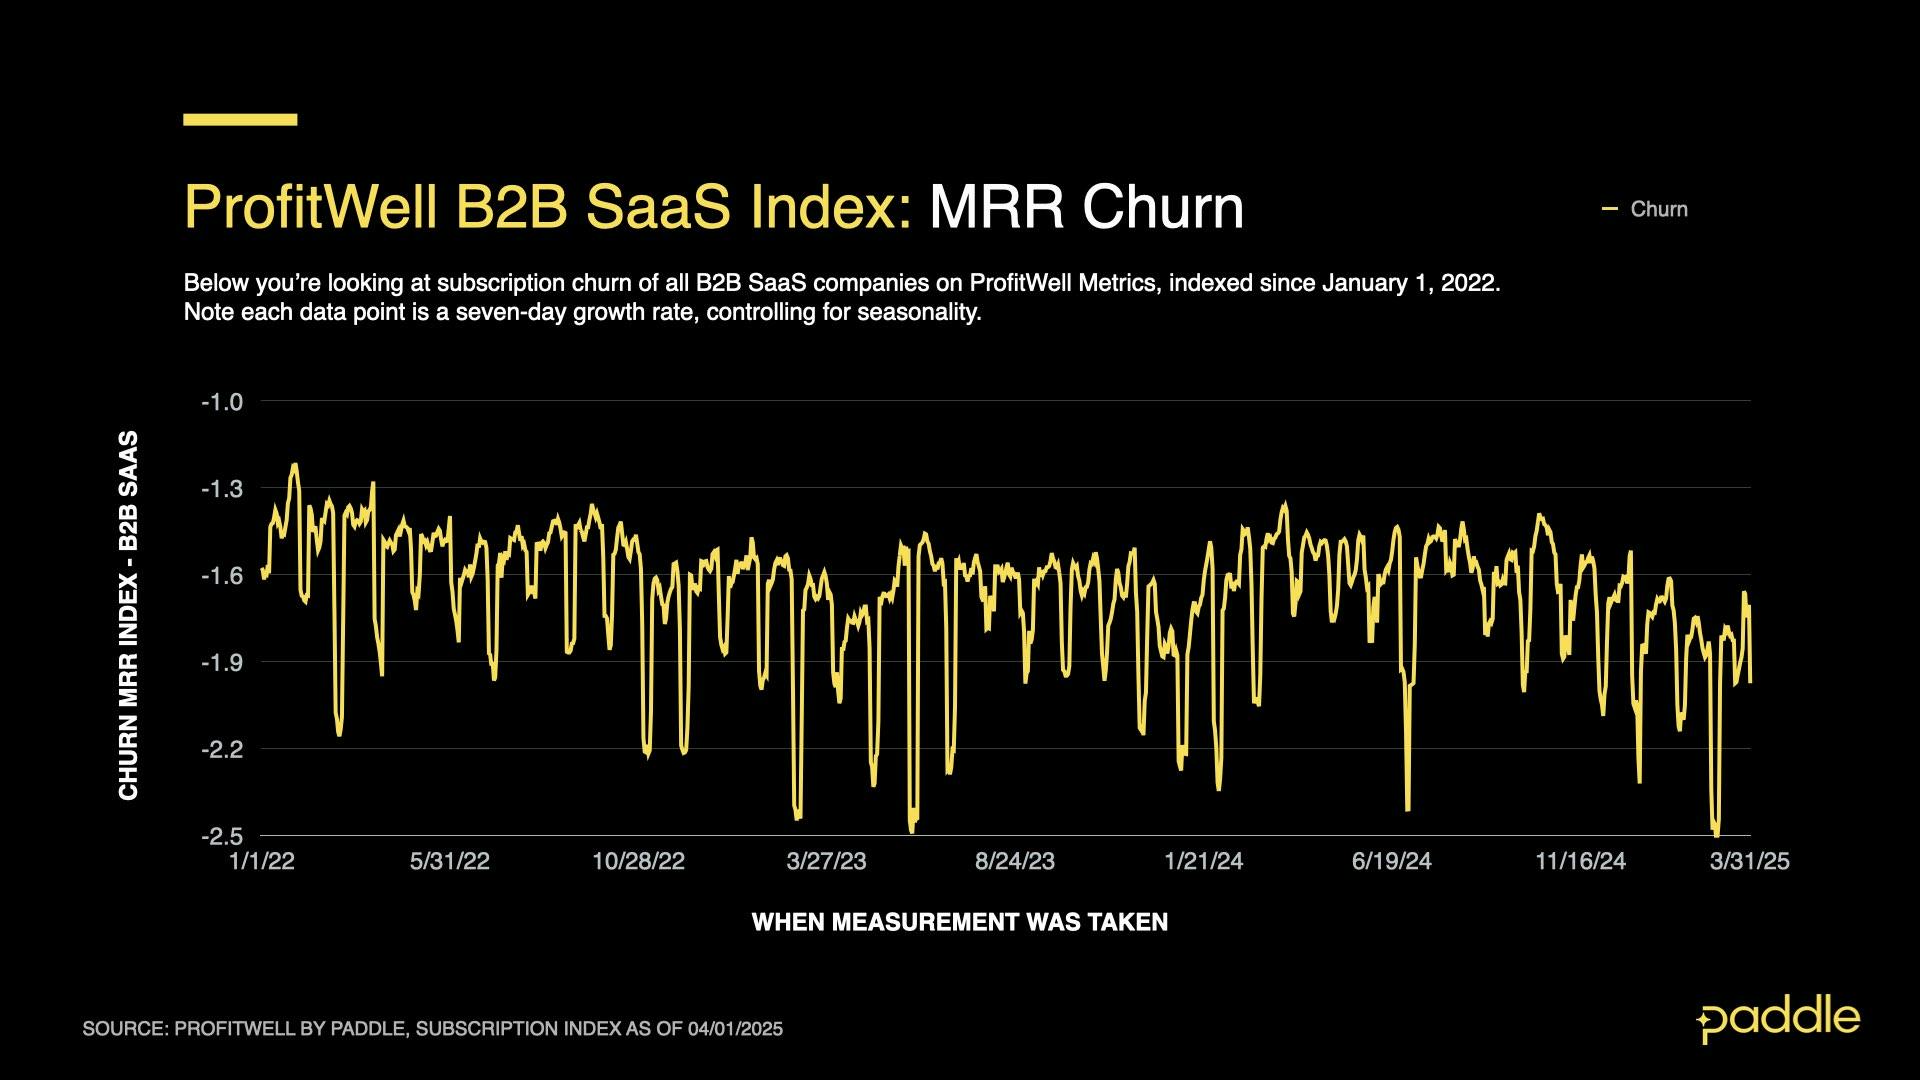
Unfortunately, this quarter’s sales gains were counteracted by a simultaneous, 11% increase in churn, with the Profitwell Churn Index increasing to an average of -1.969 in March (up from an average of -1.777 in January).
This steady and significant increase in churn throughout the quarter ended up being the primary driver of Q1’s slow recovery.
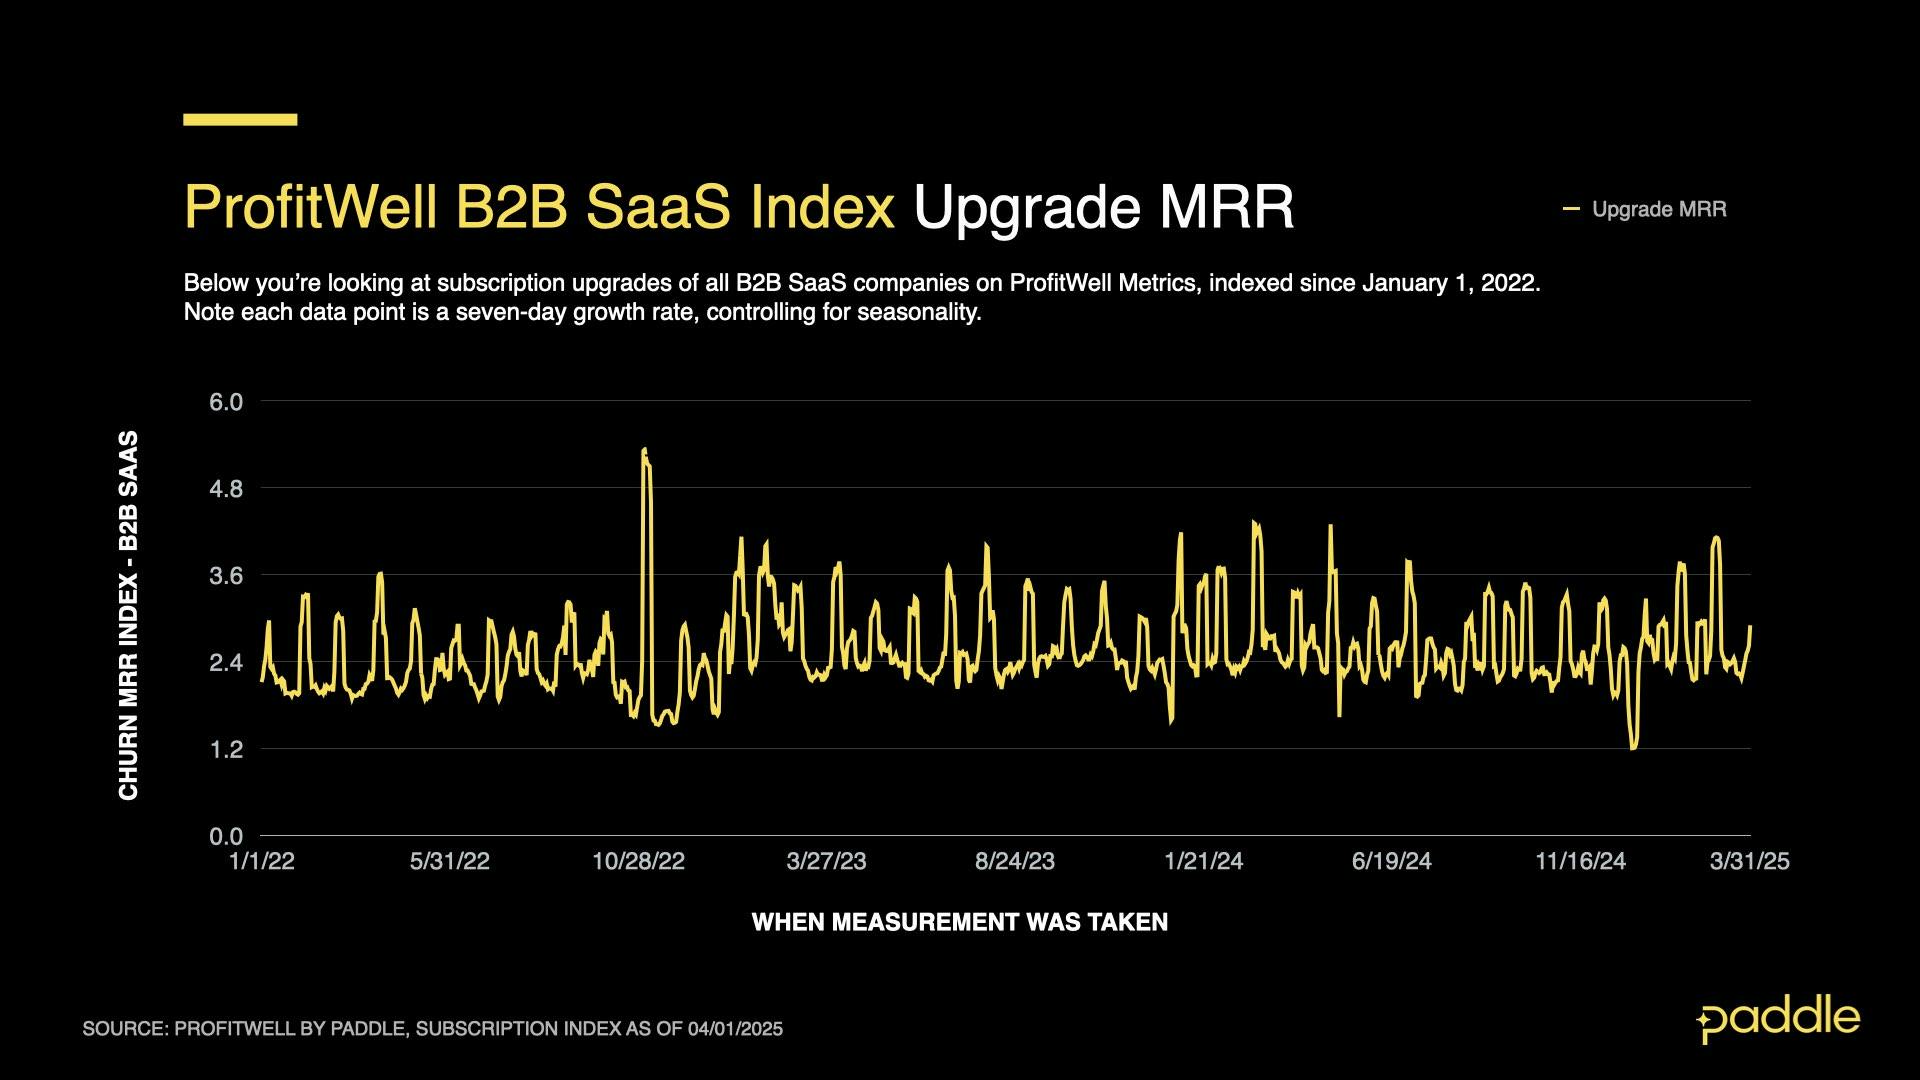
Our ProfitWell Upgrade Index also saw significant gains in Q1, growing by 11% to an average value of 2.766 in March.
While this was a significant increase, it must be noted that for a typical SaaS company, upgrades compose a much smaller share of the revenue mix than new sales or churn, muting their overall impact on B2B revenue growth.
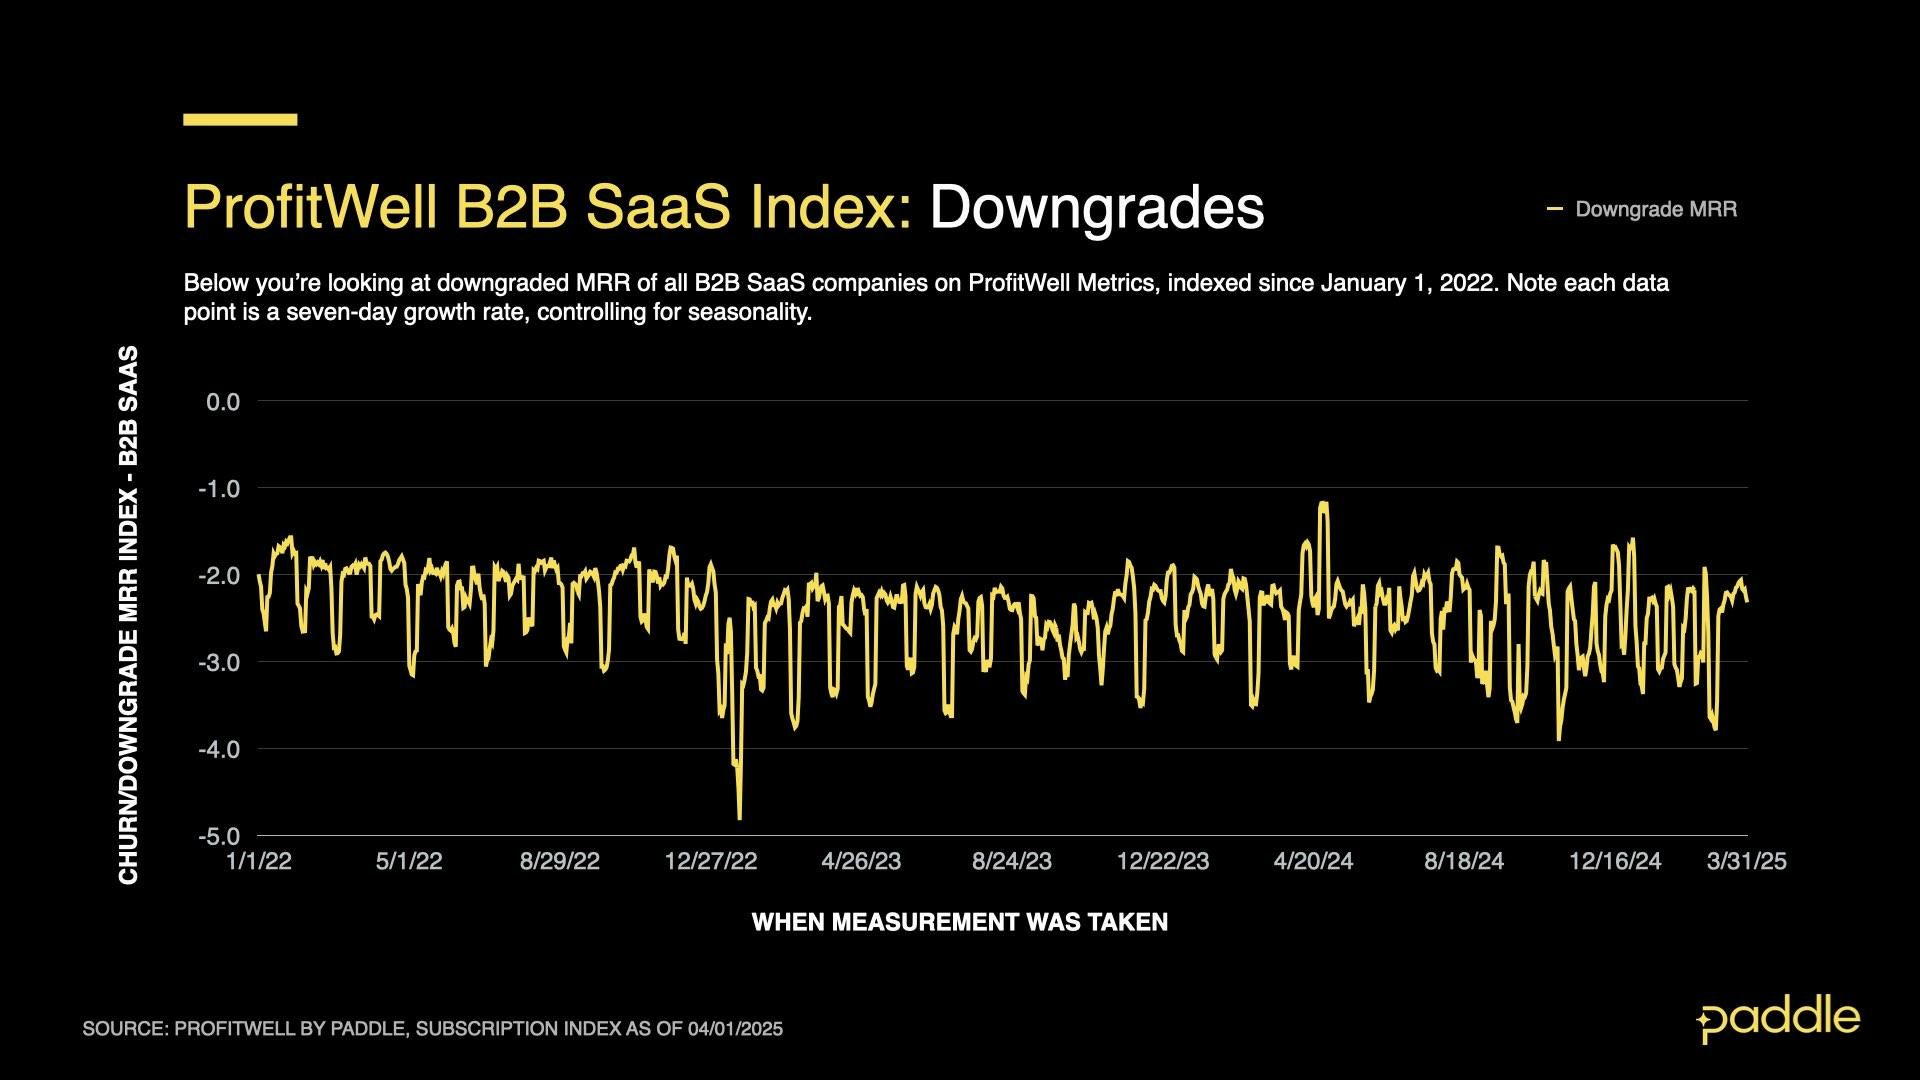
Downgrades had a similarly small impact. While they did decrease by 2% over the quarter (dropping to an average index value of -2.565 in March), this change was too small to speed up the recovery of B2B revenue over the quarter.
Putting this all together, it becomes clear that the culprit behind declining revenue in B2B this quarter was a significant and sustained increase in churn across the entire B2B index, rather than a decline in new sales (which grew at a healthy rate).
Indeed, February and March of this year brought the highest average churn rates we’ve seen, since the beginning of the B2B Index in 2019.
This appears to be a strong indicator of economic uncertainty, as companies brace for the impact of a global trade war, slash unnecessary SaaS spend, and layoff workers (with 22,000 tech workers made redundant in Q1 alone); as they prepare for a slowing economy, and industry-wide changes due to AI.
However, it is also worth noting that the steady increase in churn started in November of 2024, potentially indicating a longer-term trend that can’t entirely be explained away by economic uncertainty.
Potential factors include an industry-wide “rethinking” of enterprise tech stacks, as companies replace traditional SaaS tools with new AI-native tools (or even build DIY solutions); increased churn rates for new AI tools as companies re-learn how to build and price in a new paradigm; and large-scale re-structuring of businesses to pursue AI opportunities & products of their own.
Economic uncertainty stymies B2C too
Unsurprisingly, the effects of economic uncertainty aren’t unique to enterprise SaaS. Just like we saw with B2B, by the end of Q1, gross revenue in consumer SaaS had not grown fast enough to compensate for this winter’s temporary holiday dip.
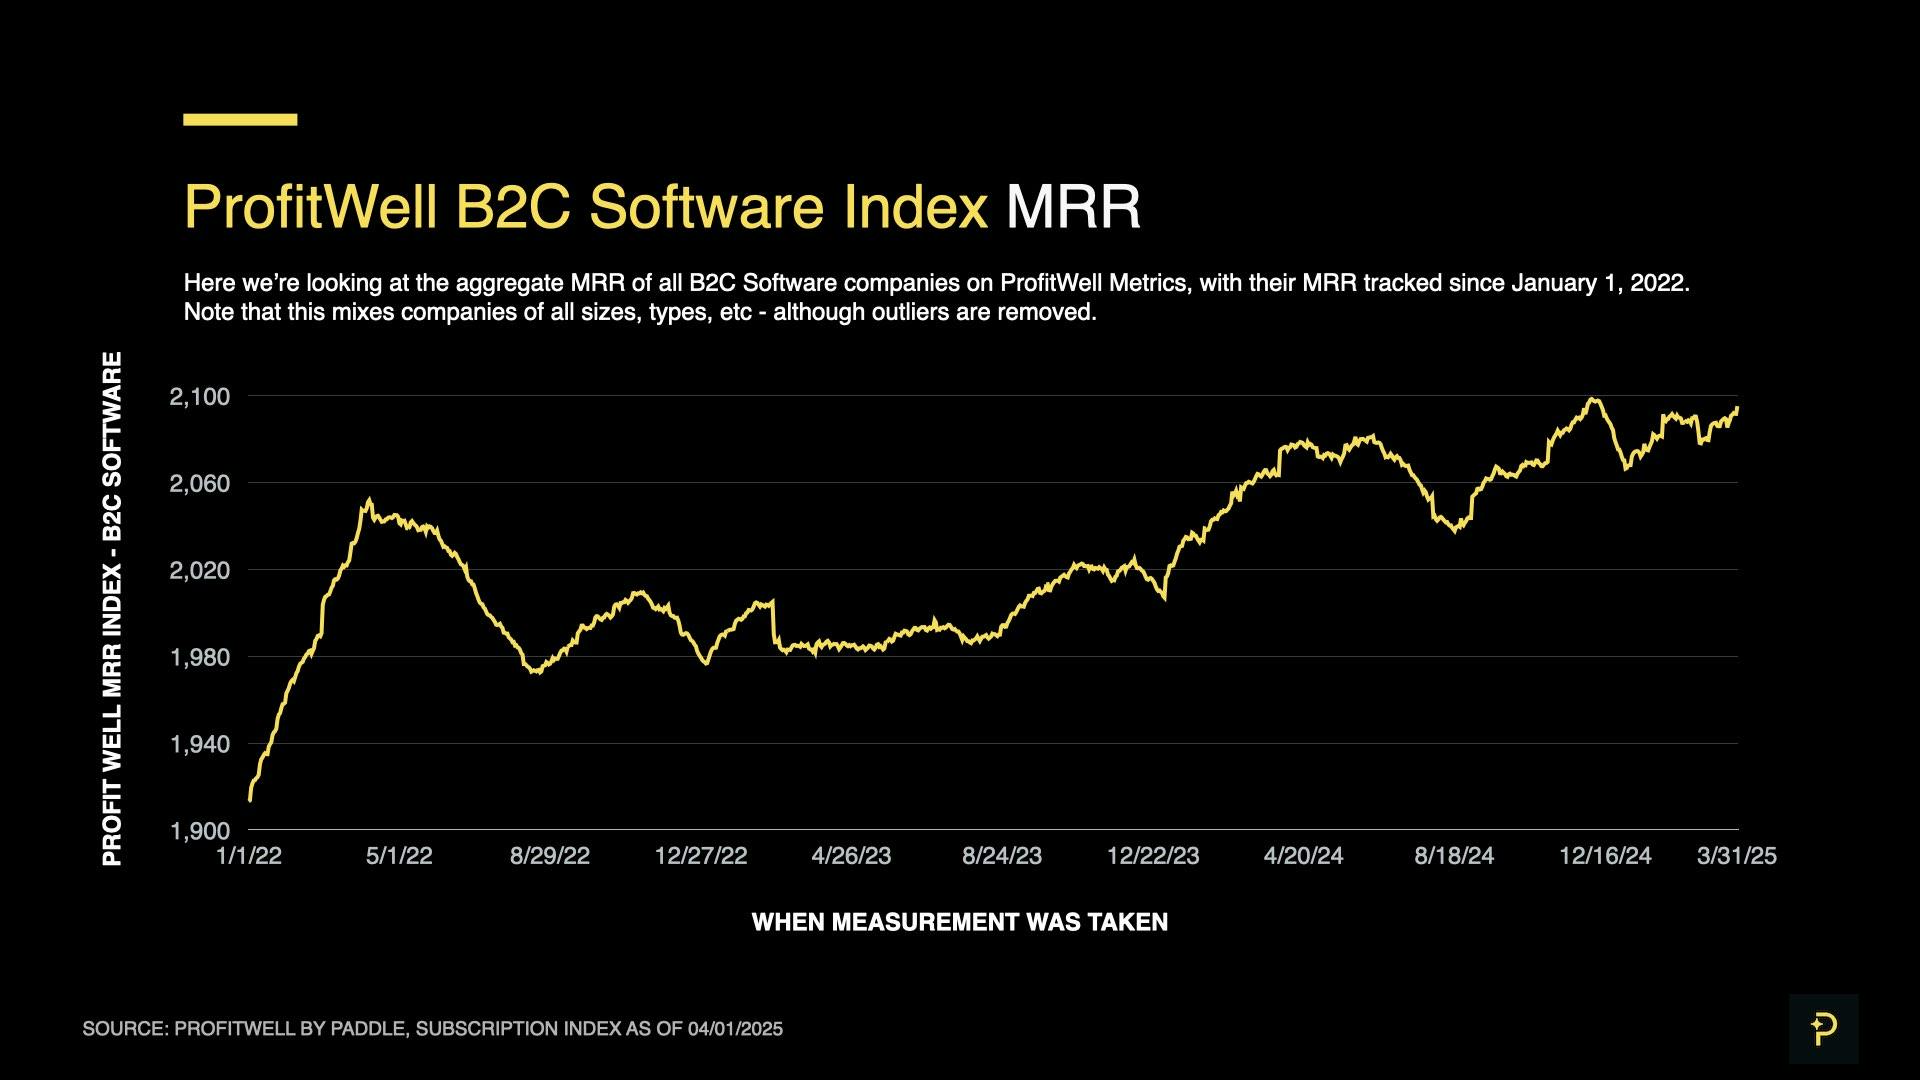
In fact, just before the holiday season, the ProfitWell B2C MRR Index (which tracks aggregate revenue across all B2C index companies) hit a peak of 2098.
However, after a dip that bottomed out to 2066 on New Year's Day, B2C failed to quickly rebound, recovering much slower than usual while taking the entire quarter to make up for the holiday losses – ultimately falling 3 points short of its pre-holiday peak of 2098.
Although this isn’t the only sluggish post-holiday recovery since the ProfitWell B2C index began in 2019, the only other time that the B2C index failed to make up for holiday losses by the end of the quarter was during the SaaS market’s 2023 contraction – just after the Fed had increased interest rates for over a year (up to 5.33%), in an attempt to curb inflation and cool down the economy.
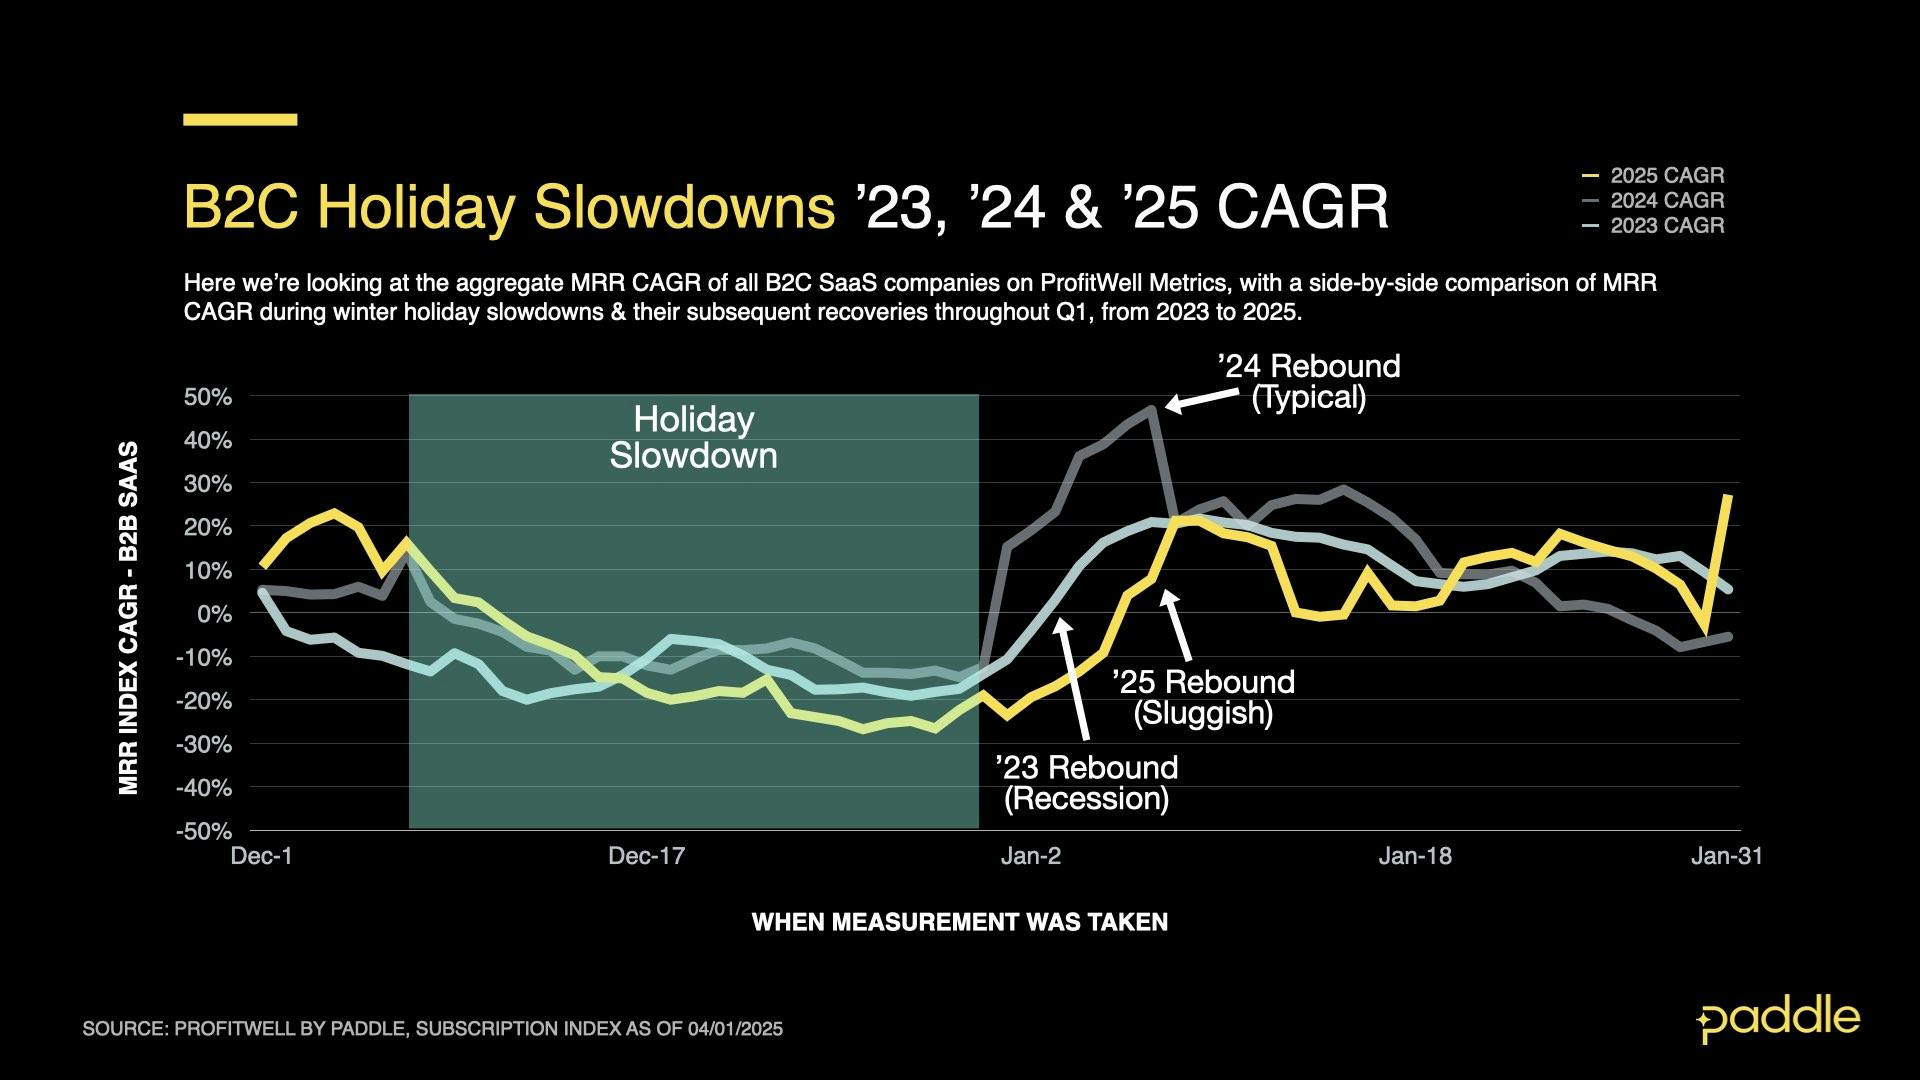
Examining compound annual growth rate (CAGR) broken out in monthly intervals backs up the narrative of a slow quarter for B2C.
In a typical year, revenue growth remains steady and positive throughout Q1. However, this year saw a -4.8% CAGR in February; making 2025 one of the only years with a contraction of revenue in February, since the start of the index in 2019.
So what caused the slow recovery in B2C? While the ProfitWell New Sales and Upgrades Indices each saw a 14% increase throughout the quarter; their gains were wiped out by a 6.9% increase in churn and a 20.1% increase in downgrades – creating a “deadlock” between B2C growth’s driving factors, and contributing to Q1’s mediocre numbers.
Moreover, a similarity in growth patterns between upgrades, downgrades & churn, potentially indicates a new, macroeconomic trend driving change in the B2C market.
Sales hold steady, other growth drivers volatile
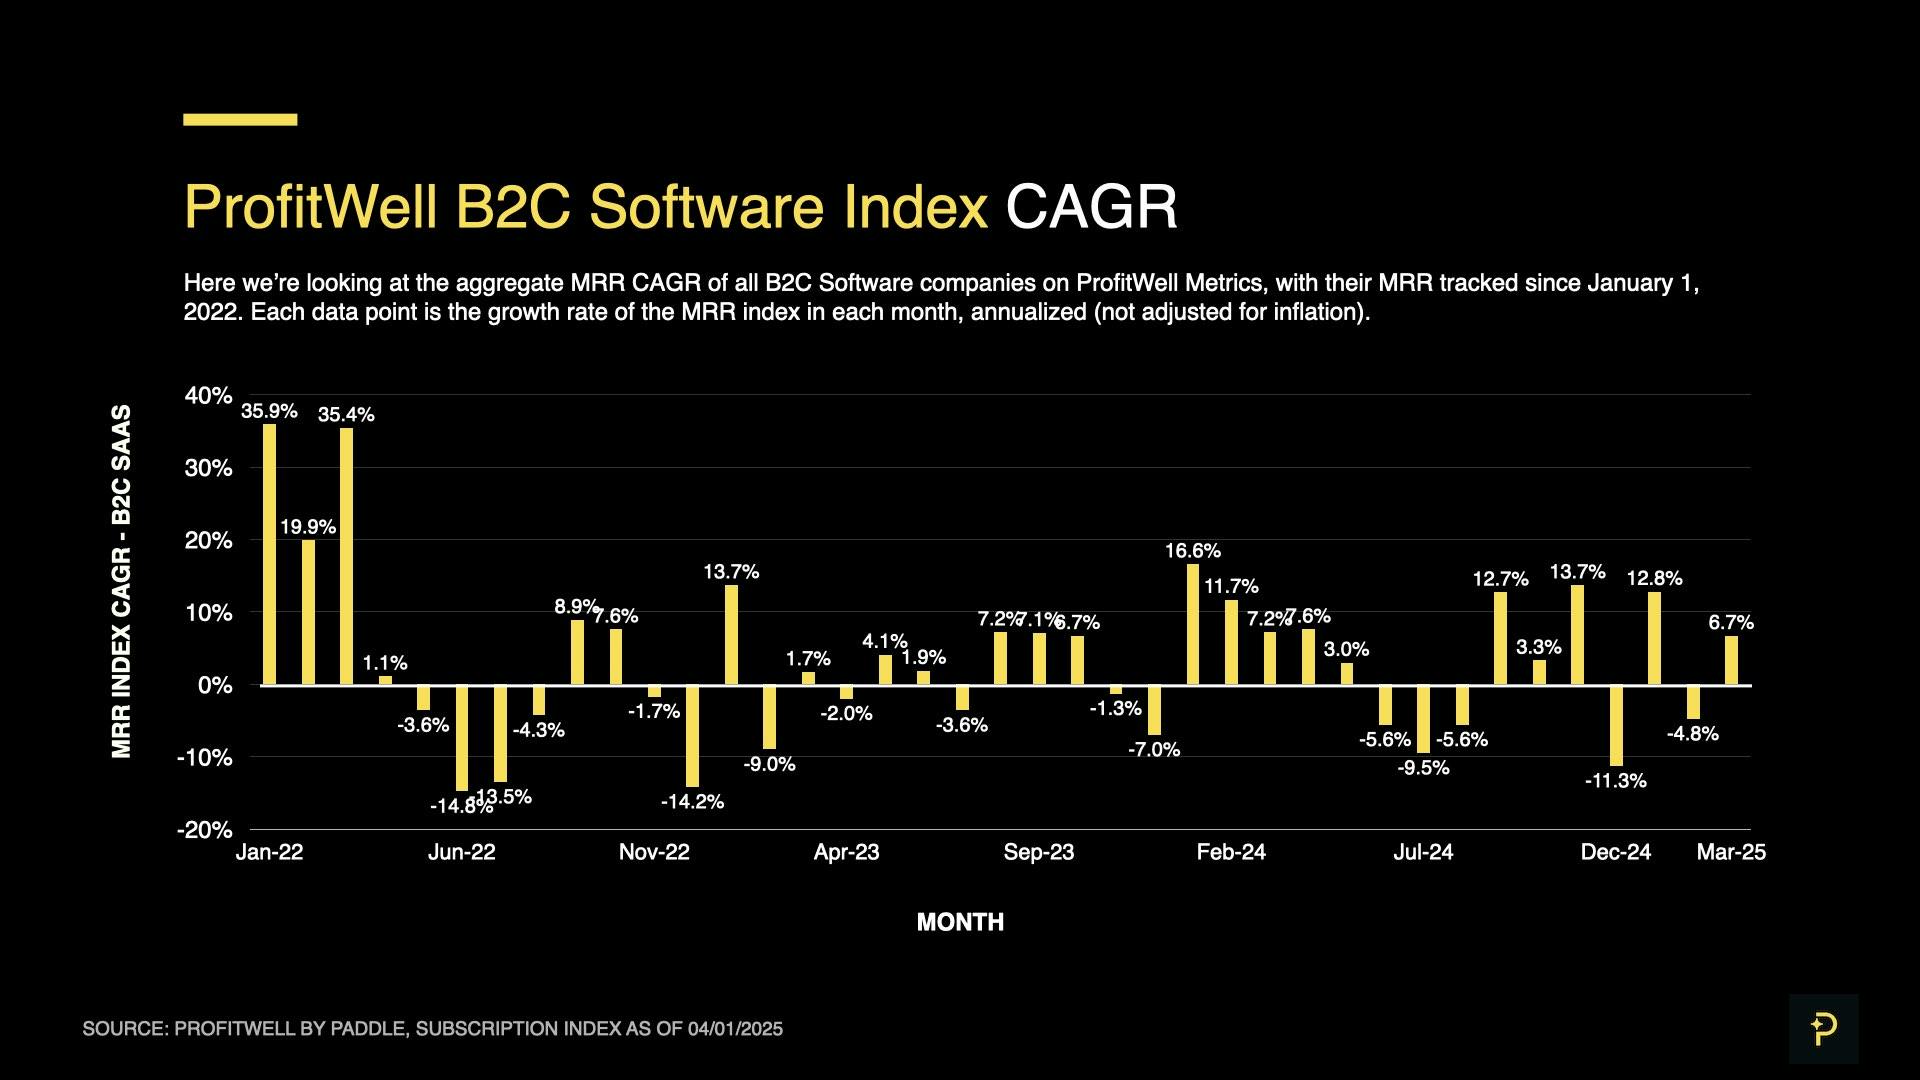
Examining the New Sales Index’s 14.1% Q1 growth, we see a gradual and sustained growth in sales, with the index averaging to 1.033 in March, compared to Q4’s average of 0.886. This may indicate that B2C sales have climbed to a new equilibrium, potentially driven by growth in consumer AI products. If this trend holds, we may see a comeback for B2C growth in Q2.
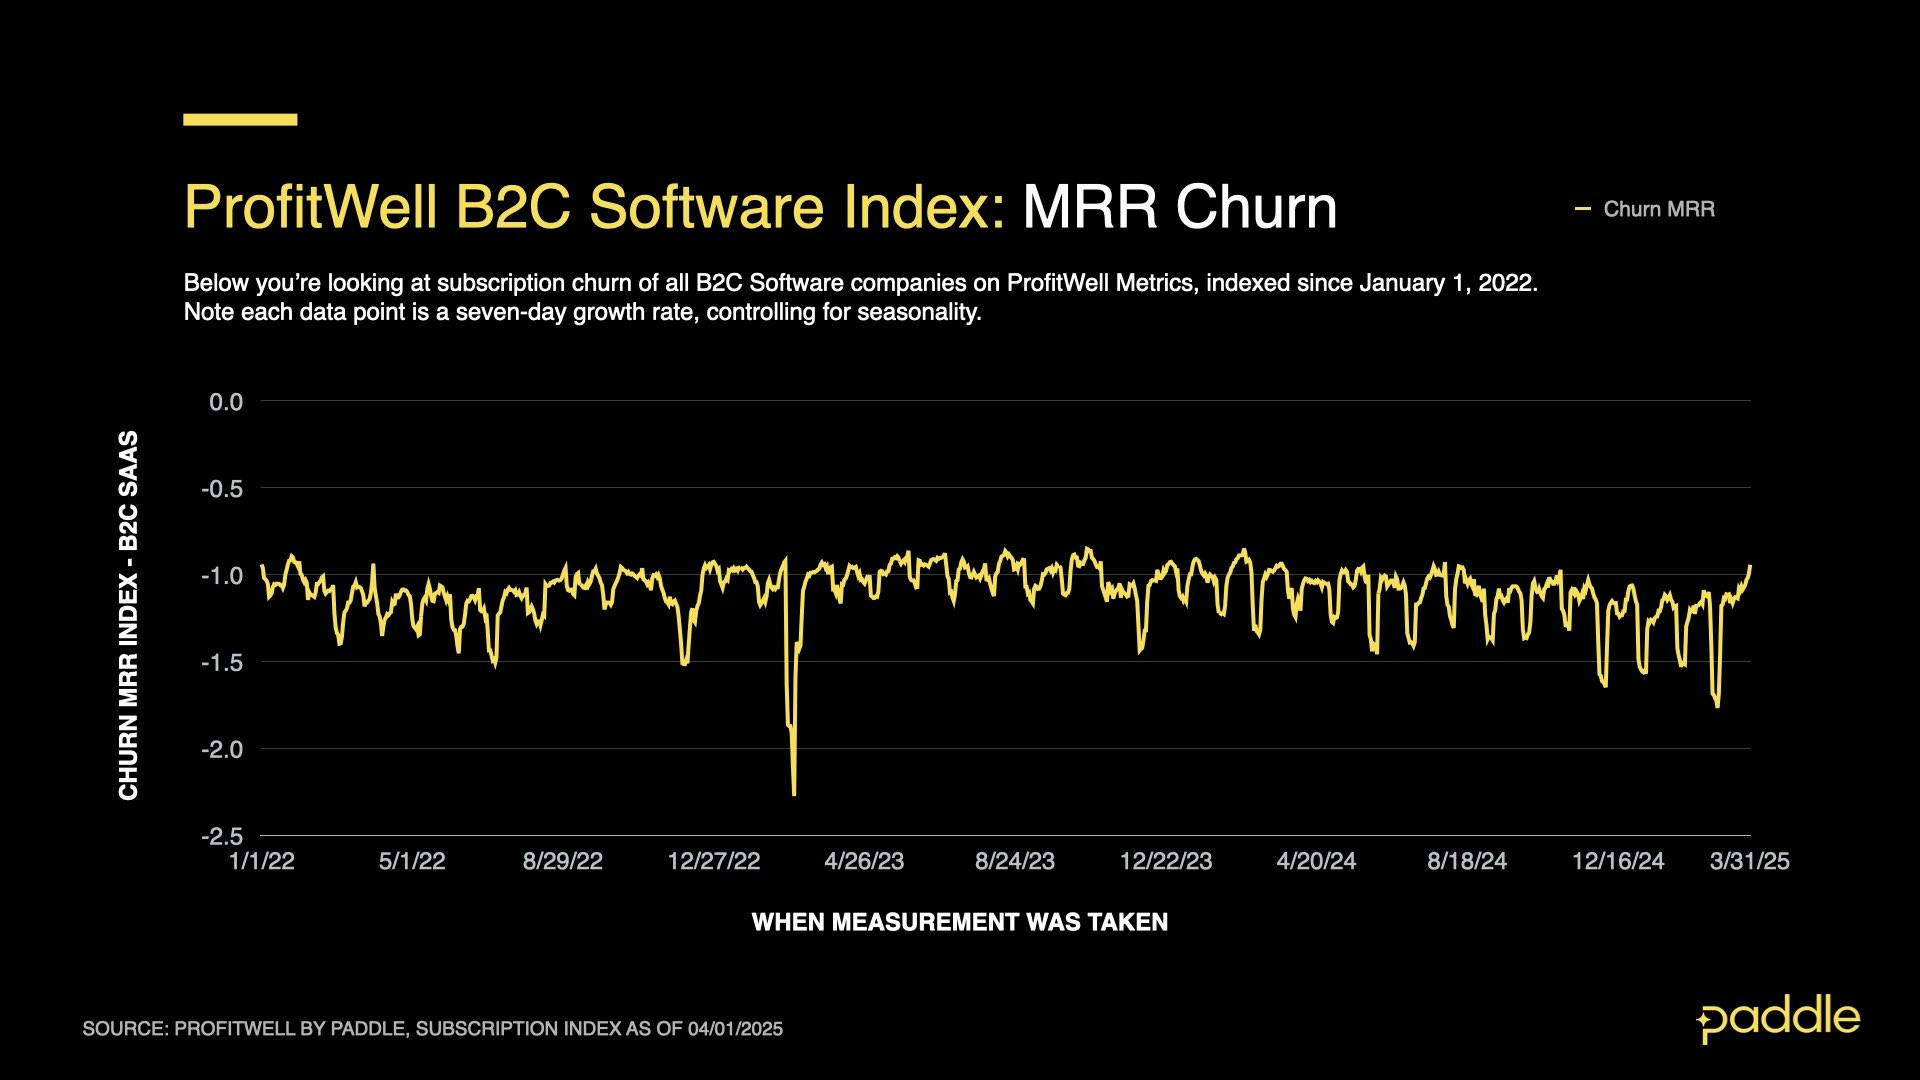
Churn rates, on the other hand, were anything but steady. They grew by 6.9% over the quarter, averaging to -1.258 on the index – but in the last three weeks of March, fell by over 44% to a value of -0.943, the Churn Index’s lowest point in 8 months. While it’s too early to tell, this may indicate a new, downward pressure on churn, with the potential to improve B2C growth rates in Q2.
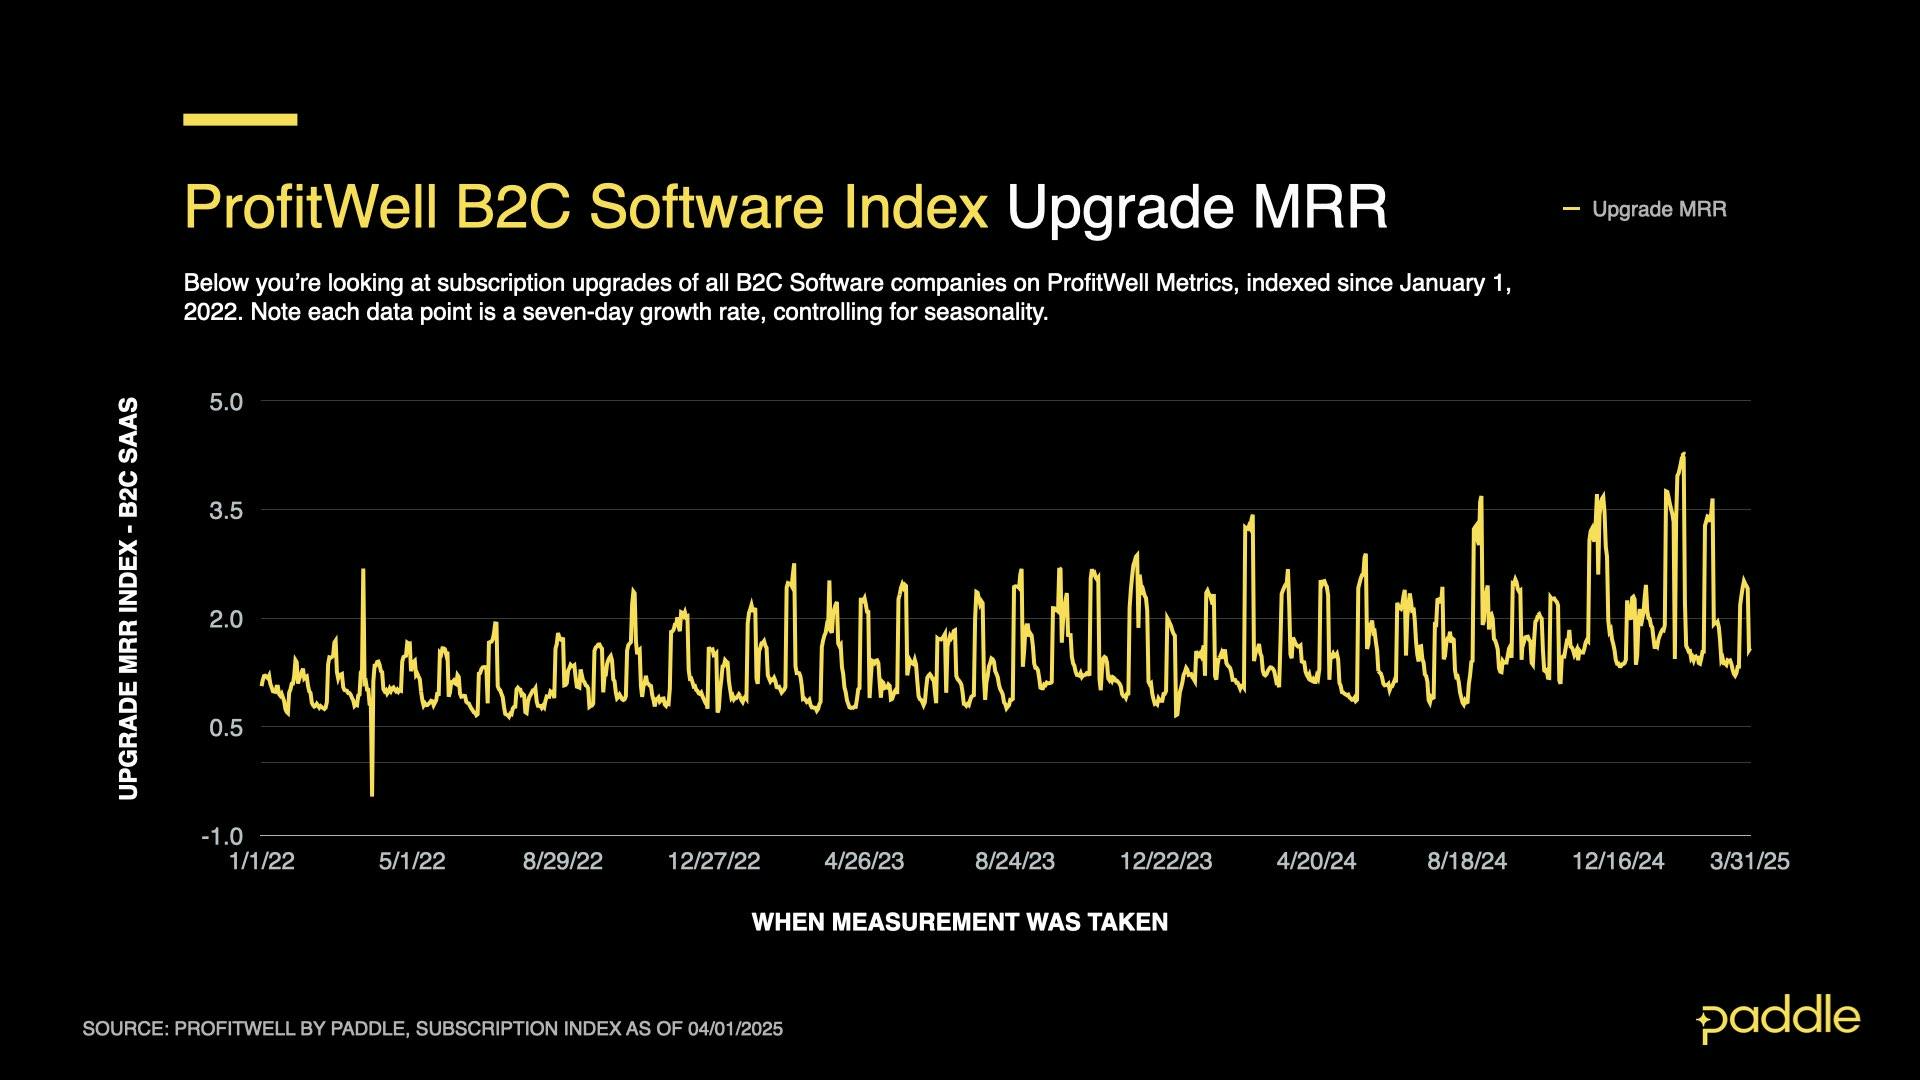
The rate of upgrades grew steadily for B2C, increasing by 14.2% over the quarter, and averaging an index value of 2.209. While this is a positive trend (perhaps tied to the steady increase in new sales observed this quarter), it must also be noted that March also brought a sharp, 27.1% drop in upgrades. It’s too early to tell whether this brings an end to the Upgrade Index’s steady climb - so we’ll be watching this closely over the coming months.
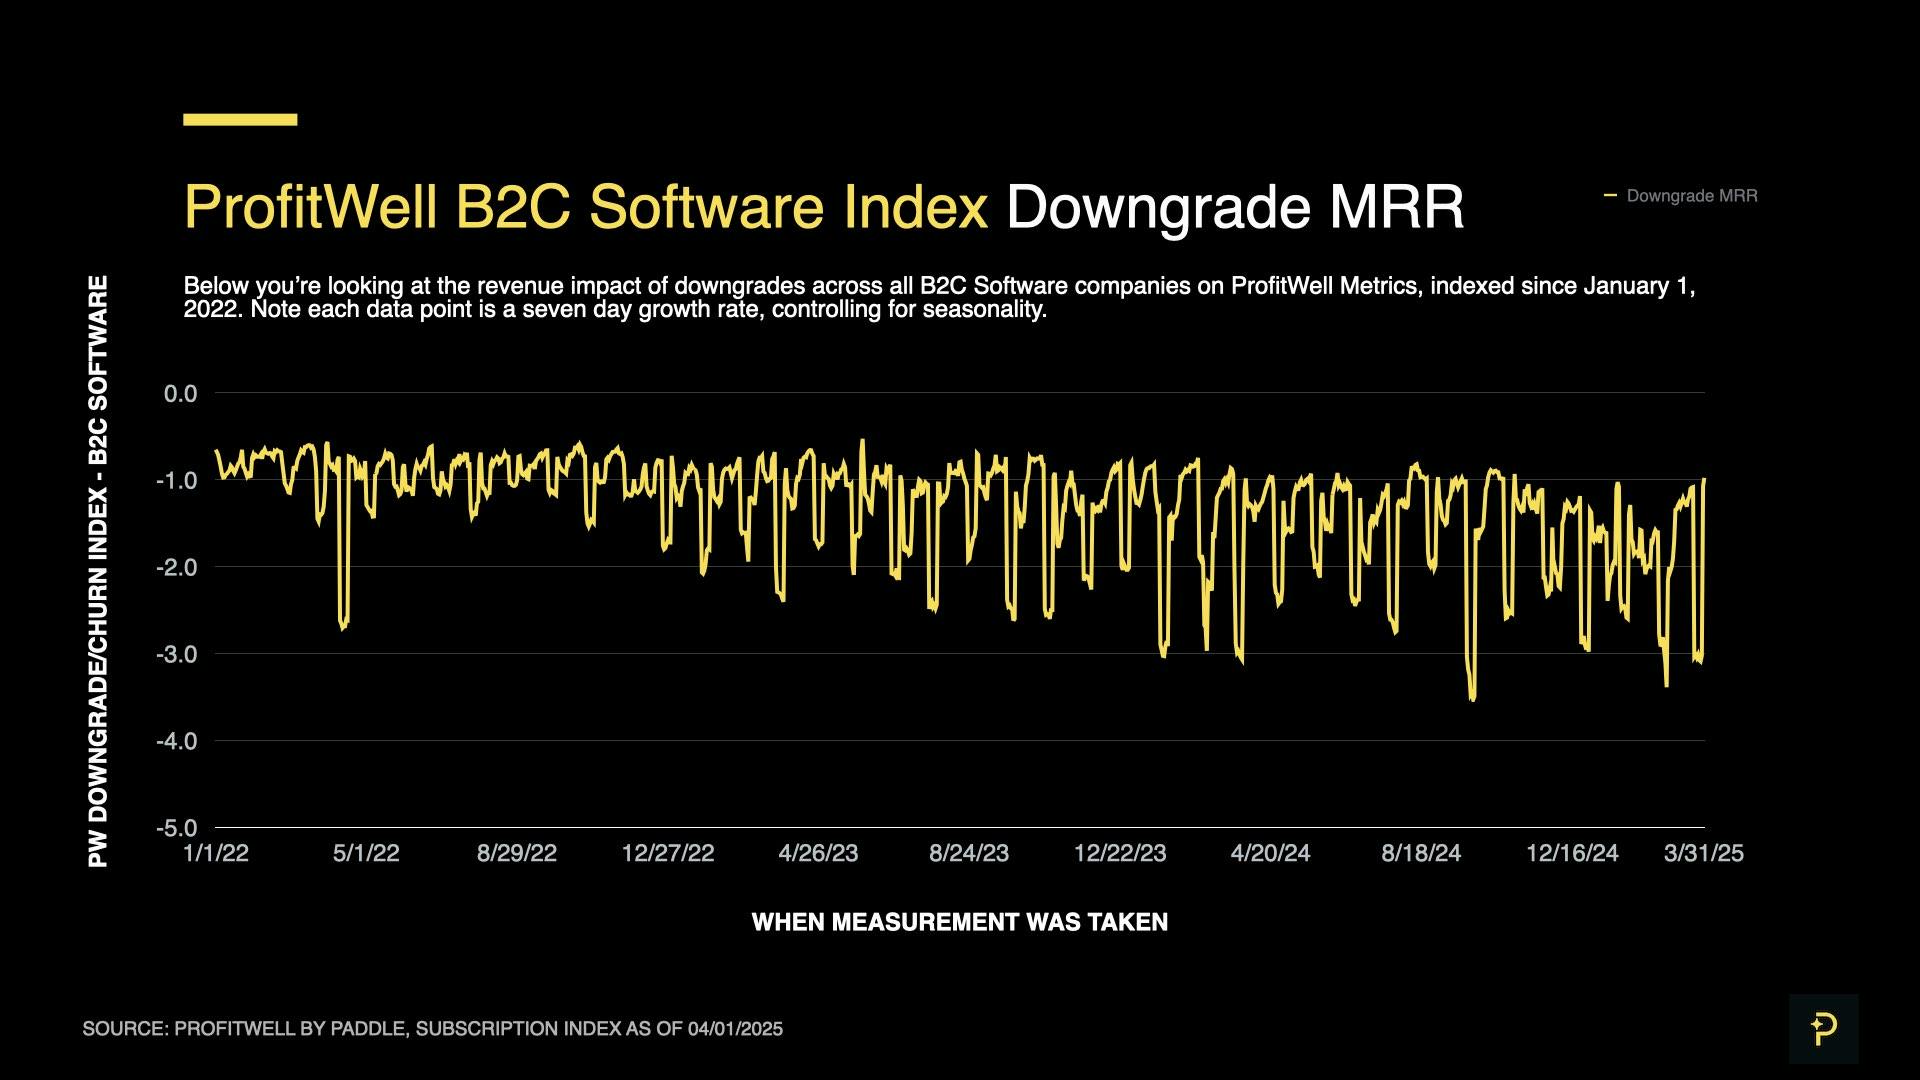
Similar to the behaviour of Upgrades this quarter, the B2C Downgrade Index grew by 20.2% on average over the quarter (reaching a mean of -1.911 on the index), before rapidly falling 16.6% in March.
So what does this all mean? The similarity in trajectories between churn, upgrades and downgrades – steady growth punctuated by a sharp drop in March – indicate broader trends driving change in the consumer subscription market. Combined with the steady growth in sales (without a significant drop at the end of the quarter), it becomes clear that consumers are purchasing new software, using it for a few weeks, then either to upgrading, downgrading or churning all together.
This provides further support for the theory that SaaS trends are undergoing significant change due to the emergence of commoditized AI models. An explosion of new AI tools, games and services is driving activity in the B2C market, and users are rapidly testing out new tools, before either dropping them or building new habits with them.
It is also much less likely that these changes in B2C are driven by the economic uncertainty of a global trade war. While there will likely be some impact from layoffs and an increase in conservative spending habits; B2C software will be much more insulated from tariffs than the enterprise software that is used by the manufacturing and industrial companies targeted by new trade barriers.
Strategies to consider
With economic uncertainty dominating headlines for the foreseeable future, and a rise in churn as AI brings massive waves of change to B2B and B2C, how can you prepare for the next few quarters this year?
Here’s a few suggestions to shore up your unit economics, and ensure your SaaS company is ready for any changes that 2025 brings.
Experiments with checkouts & billing models to find hidden growth
SaaS is a constantly evolving landscape, and the “state of the art” one year often becomes table stakes the next, especially if you’re operating in a highly competitive vertical. We encourage SaaS founders and operators to keep an open mind and be on the lookout for new techniques and processes in parts of their business that may seem like an “already solved problem”.
One of those areas is your billing model and checkout design. While tiered plans, price anchoring, and free trials all seem like table stakes now, we’ve seen innovation in the form of cardless trials recently take off.
This approach is especially effective for B2C AI apps, whose goal is to wow their users with a few demos before asking them to pay up. With these use cases, minimizing the friction between signing up and the first demo can boost overall conversion significantly.
Moreover, SaaS checkout design (which may seem like a solved problem with the high-conversion designs from many PSPs and MoRs) isn’t immune to innovation.
Recently, we’ve seen checkout recovery proliferate from the world of e-commerce (where it’s known as abandoned cart recovery) to the world of SaaS. Here, if a customer leaves at the checkout, a customizable recovery email is sent out shortly after, prompting them to continue signing up, and increasing your overall conversion rate.
Our goal at Paddle is to arm our companies with the very best tools for selling their digital products, and so, we’ll be adding cardless trials and checkout recovery to our platform very soon. If you’re interested in trying these features out, and learning even more about the state-of-the-art for selling online, check out our latest Paddle Forward session here!
Watch your margins when introducing AI
Whether you’re integrating AI with your SaaS or you’re an AI-native company, the costs of running your AI infrastructure (token use and AI calls, expensive GPUs & specialized talent) are likely eroding your margins.
The traditional SaaS model only works with ~80% margins, but many AI SaaS companies are seeing their margins drop to ~60%. This seriously hinders their product development and growth opportunities.
So, what should you do? The lowest hanging fruit is re-visiting your AI pricing. Paddle’s research shows that over 30% of SaaS companies aren’t even monetizing their AI features.
This problem is compounded by new users quickly signing up for new AI products and using them prolifically before quickly churning out, as they select other tools, or their “shiny object syndrome” wears off. Because of this, it’s important to separate acquisition from sustained usage in your pricing model.
This means offering the first few uses of your AI for free, so users can experience that magical “Aha!” moment, but gating their continued usage with a paid plan – instead of allowing them to drive up costs as “power users” while still acting on a free trial.
Which leads to our next point – avoid seat-based plans with AI-heavy products. With these pricing models, heavy AI users are charged the same as less frequent users, forcing you to increase prices for the entire user base and take a hit on your conversion rate. Instead, introduce either usage-based pricing (scaling fees according to usage) or hybrid pricing (scaling fees by usage as well as seats).
This way, power users (who get the most from your product) are charged according to the value they receive, while a wider segment of the market isn’t priced out of your product. Meanwhile, if your market is more sensitive to unpredictable pricing (especially common in the B2B SaaS world), introducing a hybrid model allows you to reduce anxieties about sudden bills, while continuing to recover costs from your most prolific users.
All of these approaches require flexibility from your payments platform and billing provider, which Paddle is well-positioned to handle, as a Merchant of Record trusted by over 5000 diverse digital product companies. If you’re interested in learning more, check out our product here!
We publish quarterly reports on the ProfitWell Subscription Index to show you where the market is headed — and help you form strategies to respond. All backed by data from the 34,000+ companies on ProfitWell Metrics.
Missed our previous market reports? You can find them here