
What is the Explore page?
The Explore page lets you dig into your data directly in the Paddle Billing Dashboard.
Pick a metric, apply filters, and group the results to spot trends or investigate unexpected changes without having to download your data.
Explore complements the Overview page. Overview gives a high-level summary of your performance, while Explore lets you examine individual metrics in more detail using flexible filtering and breakdown options.
What can you do on the Explore page?
Each view is based on four selections :
Metric
Choose the value you want to investigate:
- Revenue
- Transactions
- Refunds
- Chargebacks
- Checkout Conversion
- MRR
- MRR Growth
Filters (these match the filters on the Overview page and apply to every metric):
- Date range
- Frequency
- Product
- Country
You can select multiple products, countries or subscription frequencies and combine different filters. But you can only select one continuous date range at a time.
Breakdown
Use breakdown to group the selected metric and compare categories rather than viewing a single total
You can choose one breakdown at a time:
- None
- Product
- Country
- Frequency
- Subscription actions
'Subscription actions' is only available for MRR, and MRR Growth.
Granularity
Granularity controls how your data is grouped over time in both the chart and the table:
- Daily
- Weekly (weeks beginning on Monday)
- Monthly
You can change the granularity at any time.
How to access the Explore page
You can open Explore in three ways:
From the Overview page
Select a chart on the Overview page to open the corresponding metric in Explore. Your existing filters will be carried across.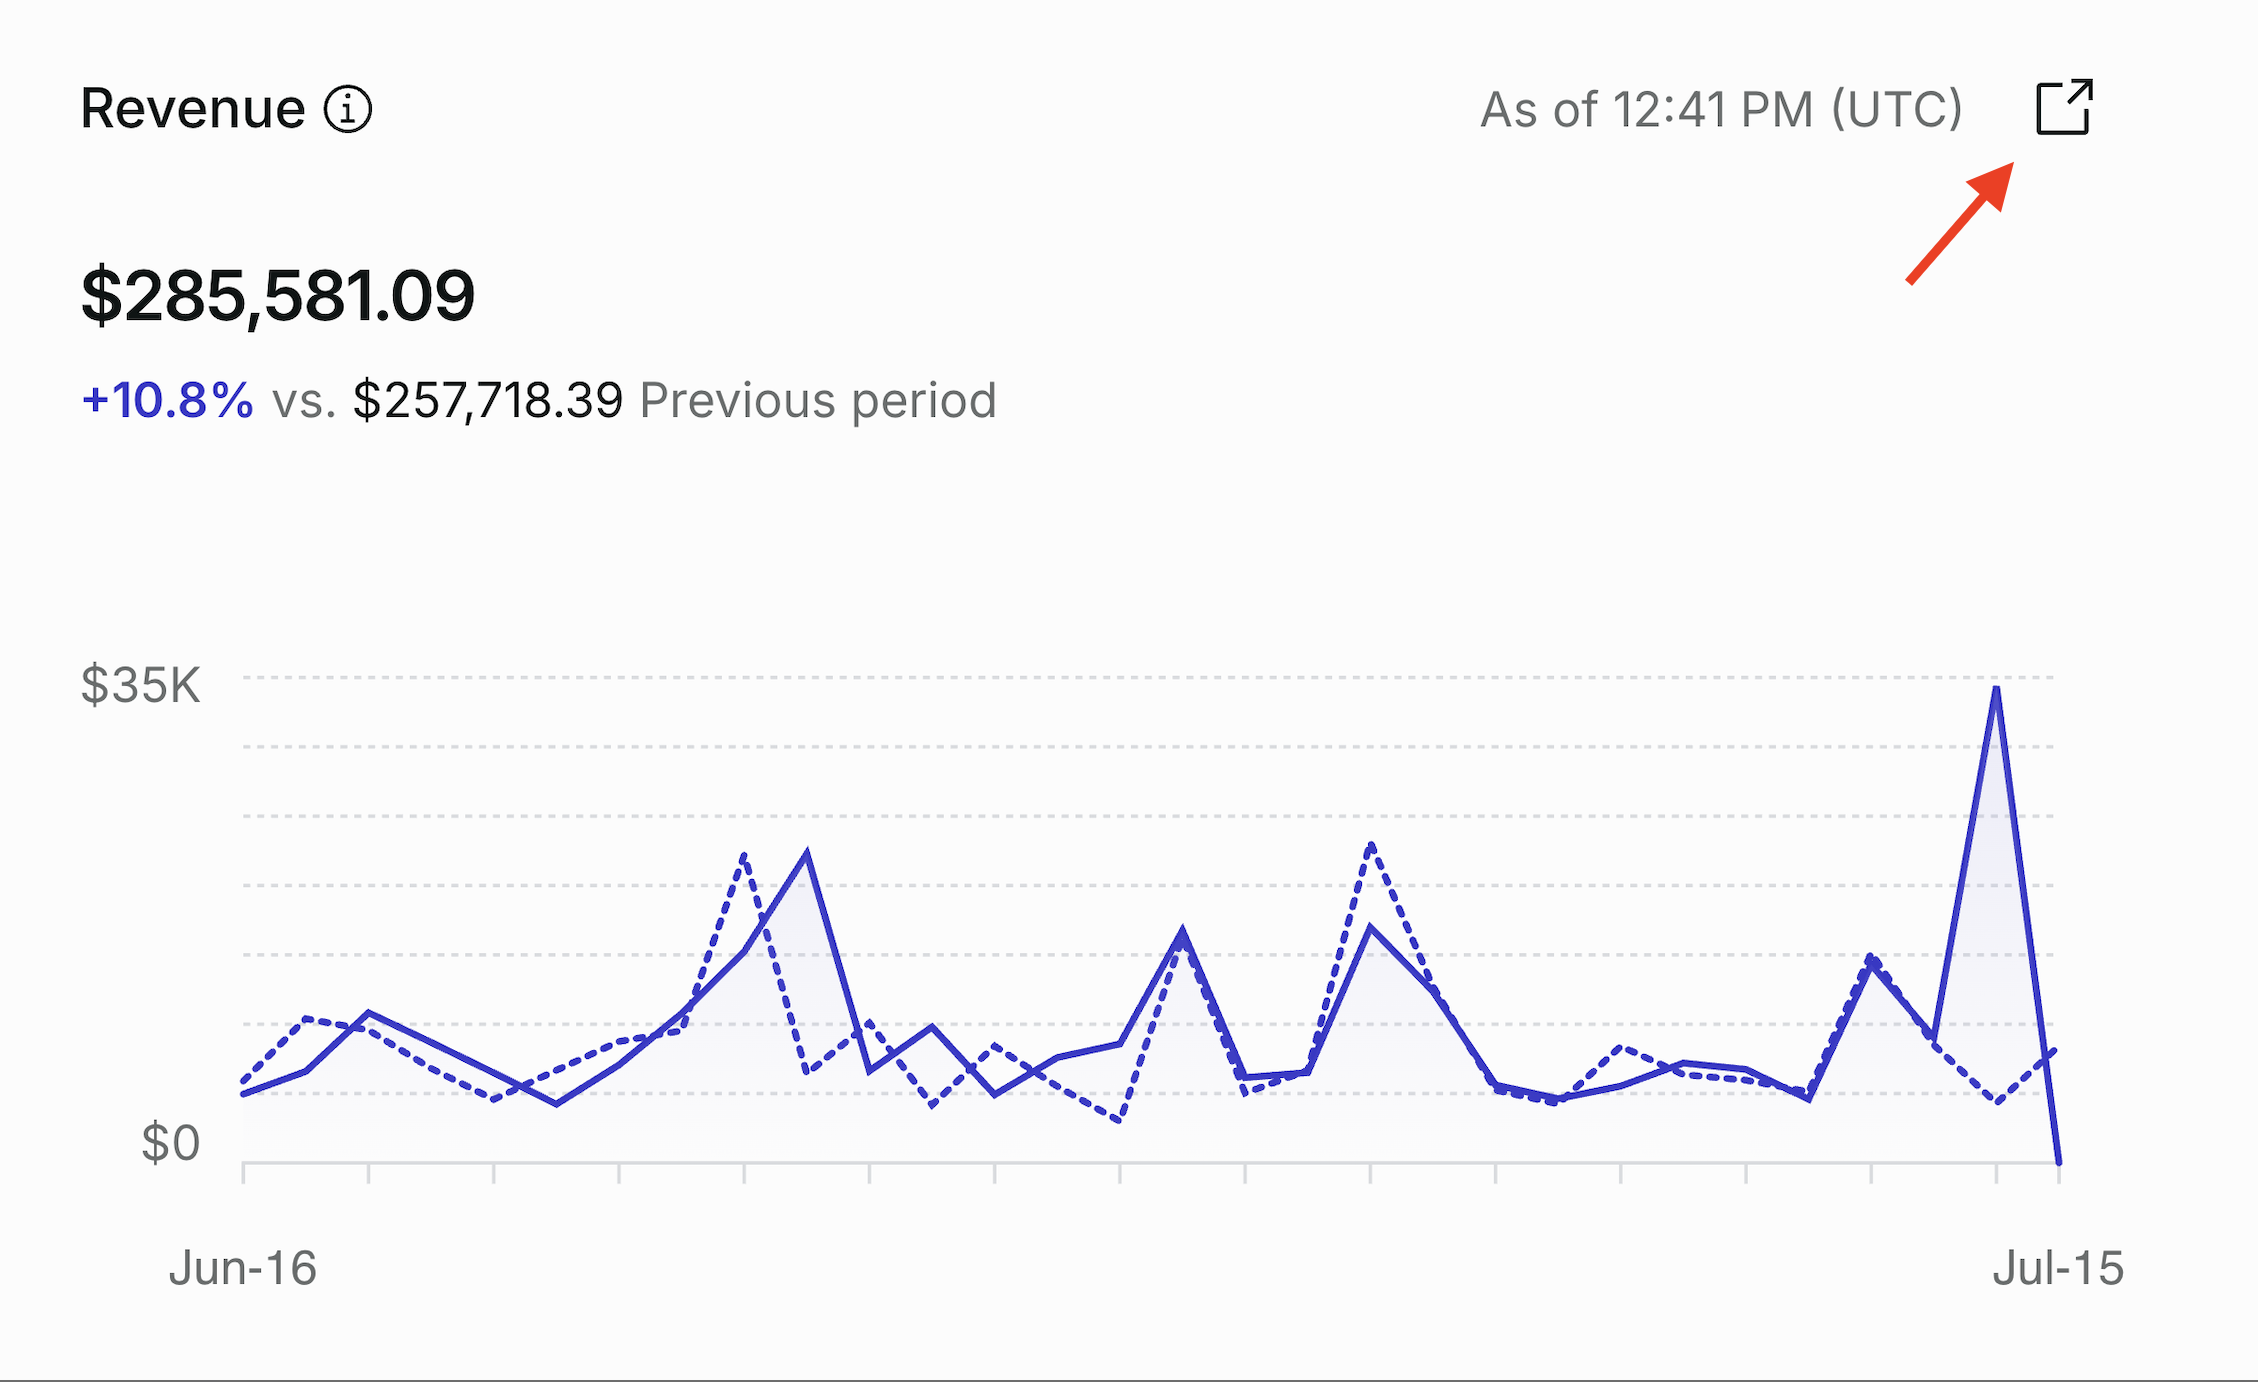
From the Dashboard navigation
Open Explore directly from the Dashboard navigation menu whenever you want to investigate a metric.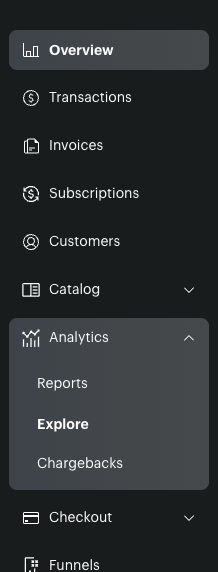
Using a shared link
The Explore page URL includes your selected metric, filters, breakdown, and granularity. You can share the URL with another user who has access to the same Paddle account, and they will open the same view.FAQs
Why doesn't the total row match the sum of the rows in the table for some metric/breakdown combinations?
Some breakdowns can put a single item into more than one row. For example, if you split Transactions by Product and one transaction includes 2 products, that transaction appears in the row for each product, but is only counted once in the total. The total row always matches the figure you'd see with no breakdown applied, so it can be lower than the sum of the individual rows above it.
Can I select more than one breakdown at once?
No, you can choose a single breakdown variable at a time. Selecting "None" removes the breakdown entirely and shows one totals row.
Can I select more than one value for a filter?
Yes, for every filter except date range. For example, you can filter to multiple countries or products at once. Date range only supports a single continuous period. You can also combine multiple filters together.
Why is "Subscription actions" only available for some metrics?
Subscription actions (e.g. new, reactivation, churn) is specific to subscription-based metrics: MRR, and MRR Growth. It isn't a meaningful way to split other metrics like Revenue or Transactions, so it's only offered for those three.
Does changing granularity affect anything other than the chart?
Yes, the table at the bottom of the page uses the same granularity as the chart, so switching between daily, weekly, and monthly changes the columns in both at once.
What does the “Other” line in the chart represent?
When a breakdown has more individual values than can be shown clearly on the chart, we display the top values individually and group the remaining ones into a single 'Other' line. This keeps the chart readable while still reflecting the full total.